Key Findings: BTC Technical Analysis
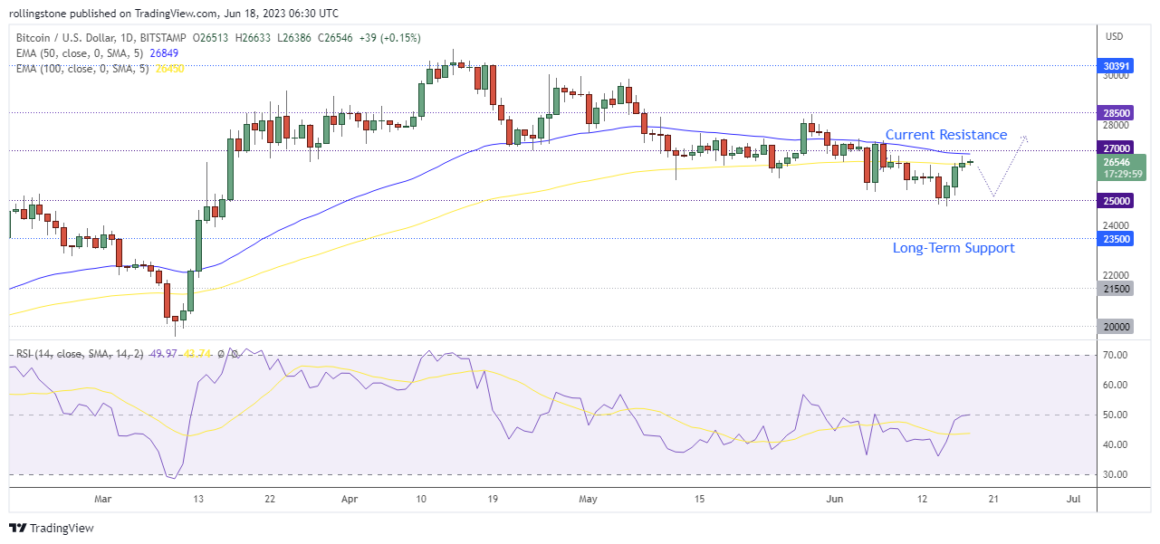
- Bitcoin stalls the current bearish rally as the price rejects the long-term support at $25,000.
- The price exceeds 100 EMA and will likely retest the immediate resistance at $27,000.
- A break above the current resistance may inspire BTC bulls hit the next resistance near $28,500.
Bitcoin Technical Analysis

Bitcoin recovered impressively to begin the weekend, with values moving closer to $27,000 in today’s session. Bulls resumed trading after a recent period of consolidation, purchasing the latest fall in the process.
To start the weekend, BTC/USD increased to a high of $26,769.39, just a day after hitting strong support at $25,000. The action had led to the price reaching its highest level since May 8, when it peaked at $26,820.
Technically, Bitcoin shows multiple signs of bullish momentum as the price moves above the 100 EMA ($26,452) with the RSI at 50.62 (above 50). However, the price must break the 50 EMA and the immediate resistance at $27K to reinstate the recent bullish rally targeting $28,500.
Key Findings: ETH Technical Analysis
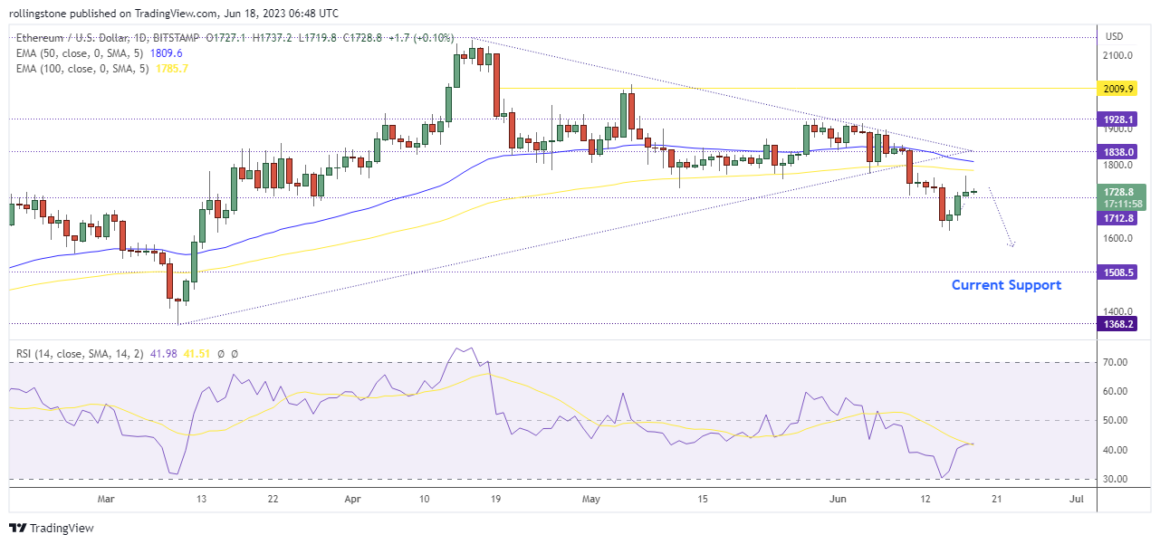
- Ethereum reclaims its position above the $1.7K, plotting a “false-break” at the current support.
- According to RSI and the 50 EMA, the price is still under an overall downtrend.
- ETH price must survive above the support at $1,712 to sustain the current bullish momentum.
Ethereum Technical Analysis

Ethereum broke the long-term support at $1,712 on Wednesday following a massive bearish move initiated after the price broke the 100 EMA support. However, the price returned above $1.7K today, restricting ETH from a further correction.
The relative strength index is still below 50 (41.92), indicating that bearish momentum still exists. Therefore, if the price breaks the support at $1,712 again, we may see ETH heading towards a further downside target near $1,508 this month.
Ethereum must hold above $1.7K for a bullish outlook and break the resistance at $1,838 to plot a solid bullish trend reversal.


