
Key Findings: BTC Technical Analysis
- Bitcoin price continues to be stuck between $31,500 and $29,508 since June 23rd.
- BTC finding buyers above $30,000 signals a potential bullish breakout of the current consolidation range.
- The price still has room to retrace near $28,500 before rejoining the uptrend.
Bitcoin Technical Analysis
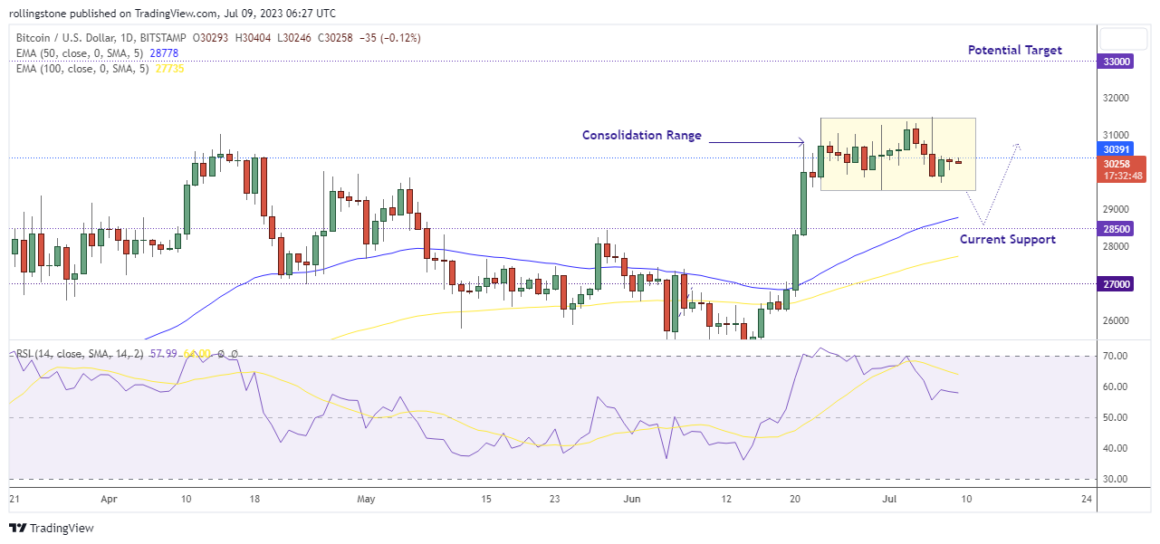
Bitcoin bulls had high hopes that the new yearly highs would break BTC/USD out of its monthly trading range, yet they were let down. They rejected the largest cryptocurrency at $31,500 before dipping below $30,000 mere hours later to test the lower end of the range.
However, according to Cointelegraph Markets Pro and TradingView data, the price of Bitcoin overnight remained steady at around $30,000 on average. It also plots a possibility that the price can make a bullish breakout while escaping the current consolidation range between $31.5K and $29,5K.
If the BTC breaks below the consolidation zone, the price can still find strong demand near the crucial support at $28,500. Bitcoin’s long-term resistance is near $33K, with support around $30K.
Key Findings: ETH Technical Analysis
- Ethereum finds support near $1,850 as the price rejects a move below the 50 EMA.
- RSI marginally remained above 50, indicating bullish momentum.
- ETH holding above $1.838 successfully will signal a potential rally above $2K.
Ethereum Technical Analysis
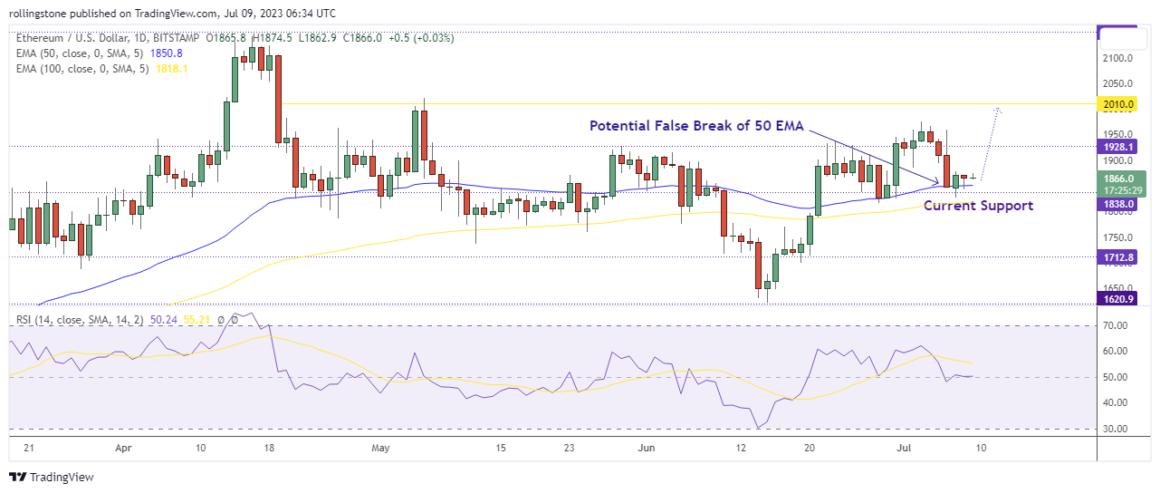
Ethereum’s price dropped near the current horizontal support at $1,838 since it plotted a false break of the resistance at $1,928. However, the price rebounded from the current support and managed to close above the 50 EMA support at $1,850.
Technically, ETH holding above the 50 EMA and the $1.8K zone will indicate the price is still respecting the current bullish trend and is keen to retest the $2,000 zone. The RSI value above 50 also signals the existence of an upside momentum.

Affiliate link — we may earn a commission.