Key Findings: BTC Technical Analysis
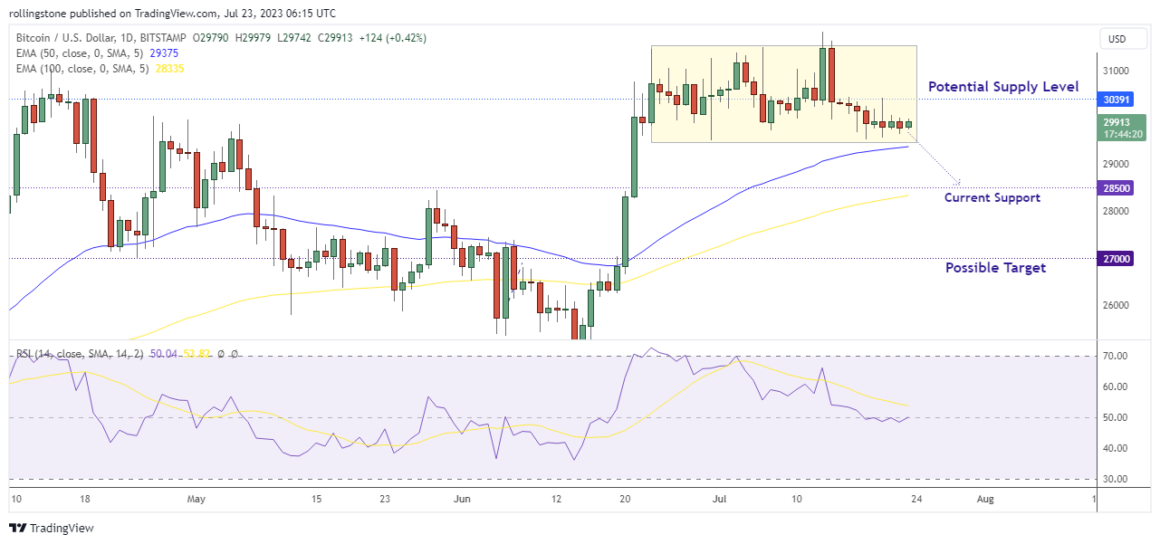
- Bitcoin price consolidating below the $30,000 level suggests a primary win for the sellers.
- The RSI value at 50 signals the market is yet to make decisions over BTC’s upcoming trend.
- A break below the 50 EMA support ($29,376) may fuel a further decline, pushing the price below the $28,500 level.
Bitcoin Technical Analysis

Bitcoin’s (BTC) price is still consolidating, but it appears bulls are giving up as the flagship cryptocurrency approaches the lower barrier. The price is now testing the critical support near the 50 EMA ($29,374), but the breakdown hasn’t been concluded yet.
According to the relative strength index (RSI), the indicator value roaming around 50 indicates a neutral momentum. So, if BTC respects the 50 EMA as a valid support, then the price may exceed the $30K hurdle by rejoining the recent bullish move.
For a bearish outlook: a break below the 50 EMA can lead the price to break the immediate support at $28,500 and retest a further downside target near $27,000.
Key Findings: ETH Technical Analysis
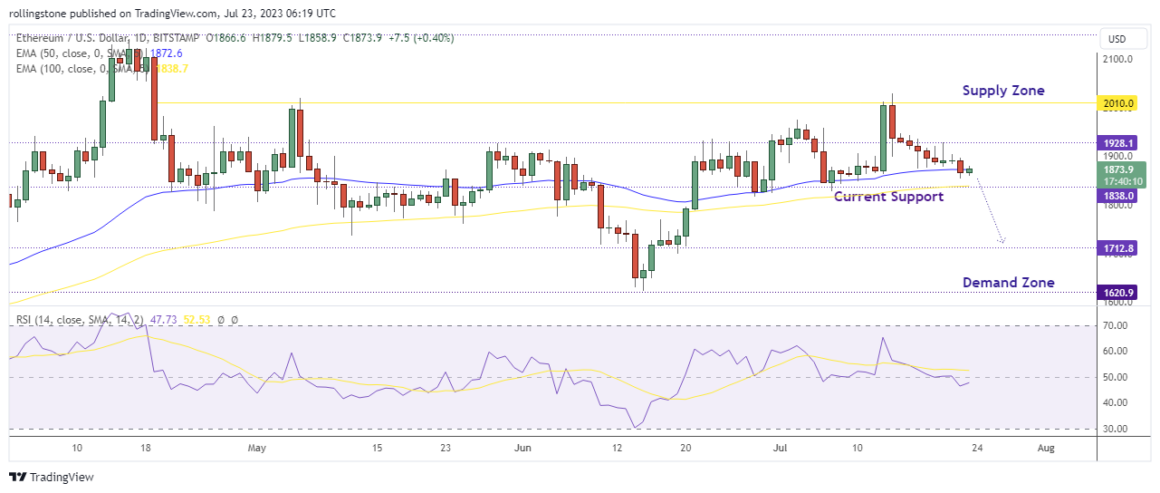
- Ethereum kept moving south following the increasing supply as the price got rejected from $2,010.
- The immediate support near $1,838 remains crucial for anticipating a further downside movement.
- ETH may break through the $1,928 barrier if bulls take advantage of the 50-EMA support during the next upswing.
Ethereum Technical Analysis

Ethereum (ETH) is also in limbo after falling below the critical support at $1,928, but there is still hope for a recent rise if bulls manage to keep the price above $1,838.
The price has reached a fork in the road after falling below the uptrend line’s support. While this collapse concerns bulls, the 50-EMA, around $1,872, has remained in control since April 21.
A bearish breakout at the current support will prove the validity of the supply zone between $1.9K – $2K, leading to more sell pressure this week. In such a case, we may see the price return to the potential demand zone below $1,712.


