
Key Findings: BTC Technical Analysis
- Bitcoin hints at more sell signals after plotting a bearish swing pattern on the daily price chart.
- BTC/USD may enter a sustainable downtrend if the support at $64K is broken.
- The weekly imbalance, which ranges from $59K to $53K is a critical area where buyers may enter.
Bitcoin Technical Analysis – BTC/USD Daily Chart
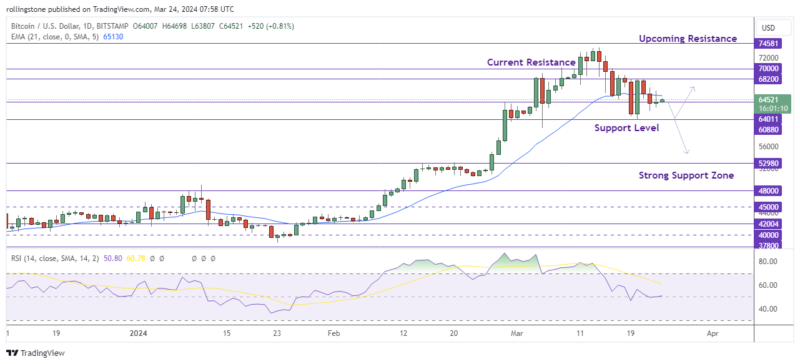
Bitcoin’s overall bullish momentum has weakened significantly during the last two weeks. This development resulted in a bearish weekly signal and an unclear monthly outlook. As a result, BTC may not be free of potential sell-offs.
The sell signal could indicate the exhaustion of momentum. As a result, investors can anticipate a potential drop in the weekly imbalance, which ranges from $59,110 to $53,130.
Despite the weekly chart exhibiting hints of recovery and a possible rebound, the monthly price chart hasn’t confirmed any bullish sign yet. The monthly imbalance ranges from $59,110 to $49,020. Bitcoin should ideally close over $64,011. Failure to do so may result in a correction of the $52,980 support level.
However, Bitcoin prices can begin to rise if buyers enter the market at the current levels. While breaking the top boundary of the current daily wedge pattern could be a favorable sign. In addition, breaking the $69,000 barrier would be a signal that might attract more buyers.
See Related: Bitcoin And Ethereum Technical Analysis: BTC Could Test The Support At $60K Despite The Current Bullish Trend
Key Findings: ETH Technical Analysis
- Ethereum price shows a consolidation mood between $3.5K and $3.2K after failing to rejoin the bullish momentum.
- The price rejected the 21 EMA with the RSI below 50, indicating a further bearish movement.
- The legal battle and debate over whether Ethereum is a security might cause the price of ETH to tumble to $3,024.
Ethereum Technical Analysis – ETH/USD Daily Chart

Ethereum price is trapped beneath the 50% Fibonacci level and could remain there for some time as the network fights against governments. Technical indicators are flashing bearishly, with the MACD diving down its signal line and the RSI breaching sub-50.
Before the next step up, the price of Ethereum might return to the $3,200 – $3,024 zone for a liquidity sweep, particularly if the price of Bitcoin keeps showing signs of weakness.
Nonetheless, if the bulls are successful in pushing the price of Ethereum over $3,602, a daily candle close above this mark will stimulate further buy orders, providing Ether with the price vigor required to continue rising, probably even to reclaim its top above the psychological $4,000 barrier. This would represent an increase of almost 20% over the existing levels.