Key Findings: BTC Technical Analysis
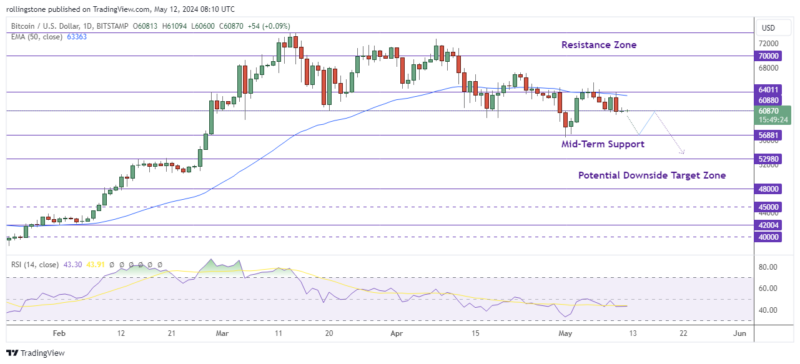
- BTC price retraces to the $60K area, about 15% lower than its $73.7K all-time high hit on March 14.
- The price is consolidating within a falling wedge formation but a strong macro uptrend persists.
- A break below the current support at $60,880 may drive the price to the mid-term support near $56,881.
Bitcoin Technical Analysis – BTC/USD Daily Chart

Bitcoin’s price slows downward, with lower highs characterizing the price movement. The outlook for the big picture is still positive, though. The US election campaigns provide Bitcoin with tailwinds, indicating that significant holders are still buying the dip.
BTC/USD has not recovered its all-time high of $73,777 on March 14. Instead, the price activity since then has been marked by lower highs. The lowest point reached by this dump was a 23% decline to the intraday low on May 2, following BTC’s bottom at $56,911.
An increased seller momentum might cause the decline to continue. Sell orders would be encouraged if the price fails to retreat its position above the 50 EMA (currently at $63,361). Retesting the prior liquidity pool below $60,880 would make sense as the next sensible objective.
Nevertheless, the bears must force Bitcoin to close below $52.9K weekly to refute the bullish thesis. This might lead to another buying opportunity for Bitcoin at the psychological $50,000 mark.
See Related: Bitcoin And Ethereum Technical Analysis: BTC Aims Further Gains After Exceeding The $50K Resistance
Key Findings: ETH Technical Analysis
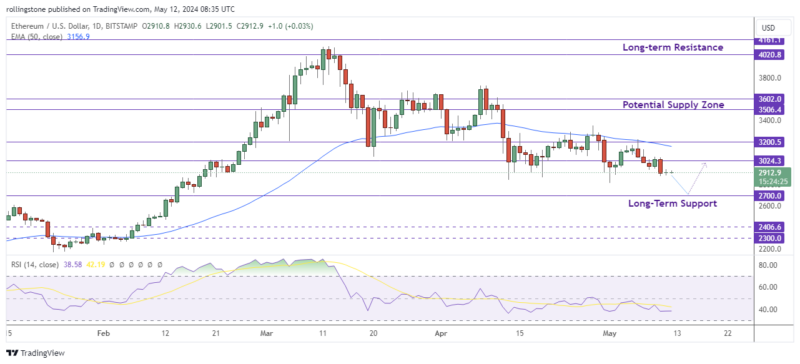
- Ethereum failed to sustain above the psychological support at $3K following a rejection from the resistance near $3,200.
- The Relative Strength Index at 38.40 signals a strong bearish momentum.
- We might see the price retesting the long-term support at $2,700 if the price fails to pull back above the current resistance at $3,024.
Ethereum Technical Analysis – ETH/USD Daily Chart

Ethereum saw a Friday price inefficiency that caused it to drop from $3,044 to $2,906. Alongside this was a rapid liquidation of long bets, with $27 million going down in four hours.
The move is hardly unexpected because, despite trader uncertainty, ETH has been trending lower over the last several days. Crucial forecasts, however, are still in place because ETH is probably going to stay trading between $2,852 and $3,000.
According to the daily chart, we might see ETH/USD make a further downside rally hitting the long-term support at $2,700 if the price fails to make an immediate pullback above the $3,024 level.


