Key Findings: BTC Technical Analysis
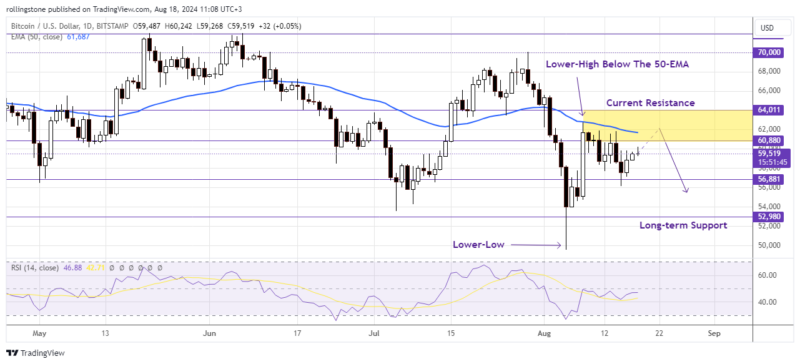
- Bitcoin daily chart printed multiple inside bars since August 8, indicating a price consolidation.
- A potential bearish breakout is expected as the price remains below the 50-EMA.
- BTC might retest the $56,881 – $52,980 zone if the price fails to exceed the $60K level.
Bitcoin Technical Analysis – BTC Daily Chart

After testing and failing to break through the resistance near $62,000 last week, Bitcoin (BTC) traded above $58,000 on Friday.
This week saw a return of the risk-on sentiment in the markets as Marathon Digital increased its holdings of 4,141 Bitcoin worth $249 million and the SEC approved a new MicroStrategy leveraged ETF, which could increase investor exposure to the cryptocurrency.
The RSI at 47.17 (below 50) indicates an overall downtrend. Besides the price remaining below the 50-EMA since August 2 suggests further bearish movements this week.
If BTC continues to find resistance around $60,880, it might fall 14% from its current trading level of $58,231 and retest the daily support near $52,980.
See Related: Bitcoin And Ethereum Technical Analysis: BTC Drops To $60K And Hints For A Further Correction
Key Findings: ETH Technical Analysis
- Ethereum develops a short-term bullish momentum but the price must break above the $3K level to initiate an uptrend.
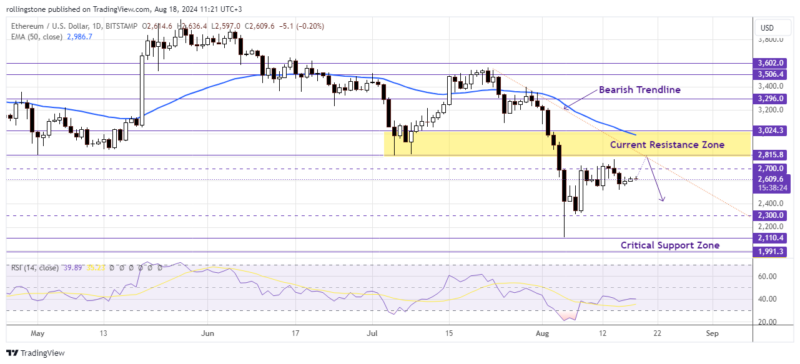
- Technically, ETH will remain bearish as long as the price rejects the immediate resistance at $2,815.
- A clear rejection of the current trendline resistance might drive the price below the $2,300 level.
Ethereum Technical Analysis – ETH Daily Chart

The cryptocurrency market continues to consolidate, with Ethereum showing substantial resistance to an upward trend. Since the dramatic collapse on August 5, ETH’s price actions have been primarily horizontal, with a downward trendline serving as a continuous barrier to any recovery attempts.
The price has fluctuated over the last month, reaching $3,000 before falling around $2,600 support due to negative pressure. Ethereum price research reveals significant movement between $2.3K and $2.7K, the region in which Ethereum has been oscillating, indicating a consolidation phase.
Ethereum has found support at $2,300, a psychological level for traders. Breaking below this level might result in additional selling, potentially reaching below $2,110.
On the upside, ETH faces resistance from a declining trendline of about $2,700. Above, there may be a short-term rally, but the overall market bias is negative.


