
Key Findings: BTC Technical Analysis
- Bitcoin price dipped below $60K as speculators started to cash in on the previous week’s surge.
- A false break of the resistance at $64,011 and a bearish breakout of the 50-EMA formed a huge sell pressure.
- If the price fails to sustain above the immediate support at $56,881, we might see BTC hitting the $52K – $50K zone this week.
Bitcoin Technical Analysis – BTC Daily Chart
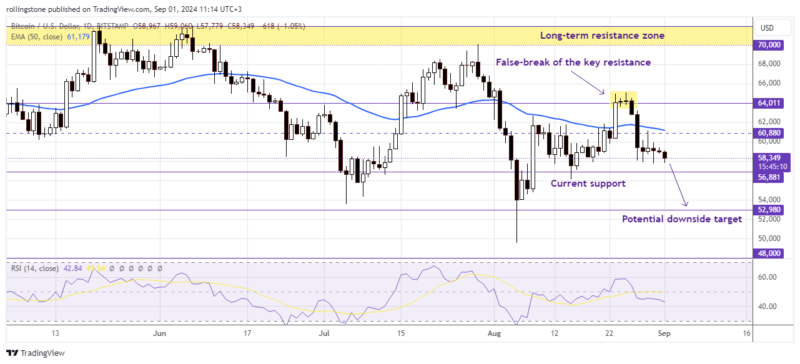
After a hectic week of speculators taking profits, the price of Bitcoin dropped below $60K and is currently trading at $58,800. Following a brief spike last Saturday that sent Bitcoin above $64K due to a rekindled likelihood of a rate decrease by the Federal Reserve (Fed), investors started to book profits.
The price confirmed a false break of the key resistance at $64K on August 24 and broke below the 50-EMA support, indicating more corrections in the dip. However, we have immediate support near $56,881, which could be a crucial deciding zone for a fresh move this week.
According to the Relative Strength Index (RSI) value at 42.81, BTC/USD is under a bearish momentum and might not survive the support at $56K. In such a case, we might see the price drop to a further downside target near $52,980.
See Related: Bitcoin And Ethereum Technical Analysis: BTC Price Consolidation Below $60K Hints Further Corrections
Key Findings: ETH Technical Analysis
- Ethereum’s recent consolidation within $2.8K – $2.3K confirms the price has yet to decide whether it moves above or below the $2,500 level.
- However, the price is below a bearish trend and could enter the $2.3K – $2.1K zone this week.
- The resistance at $2,815 and the 50-EMA levels could be a crucial pullback zone for fresh sell entries.
Ethereum Technical Analysis – ETH Daily Chart
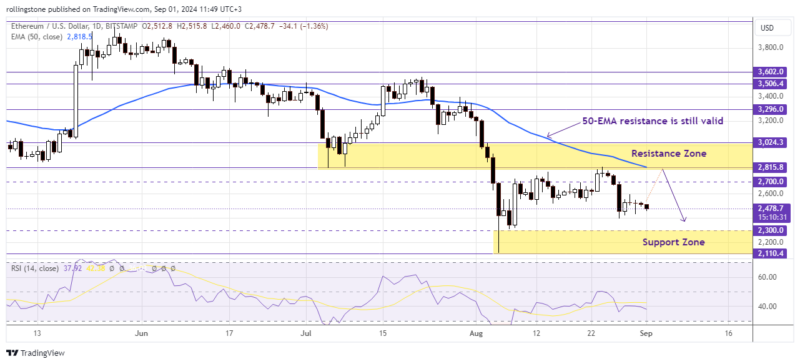
Ethereum price has been moving within a wide consolidation range of $2,815 and $2,300 throughout August 2024. Despite being under a solid downtrend, the price is still trying to sustain above the $2,500 level.
The Relative Strength Index (RSI) declined to 37.97, suggesting the existence of a sustainable bearish momentum. However, the price hasn’t made a bullish or bearish breakout of the current inside bar range yet. So, we can expect a potential pullback to the 50-EMA level despite the ongoing bearish trend.
A bearish breakout from the immediate support at $2,300 might lead the price to a deeper target near $2,110. For a bullish outlook, the price must exceed the resistance at $2,815 and the 50-EMA to attract more buy pressures.