Key Findings: BTC Technical Analysis
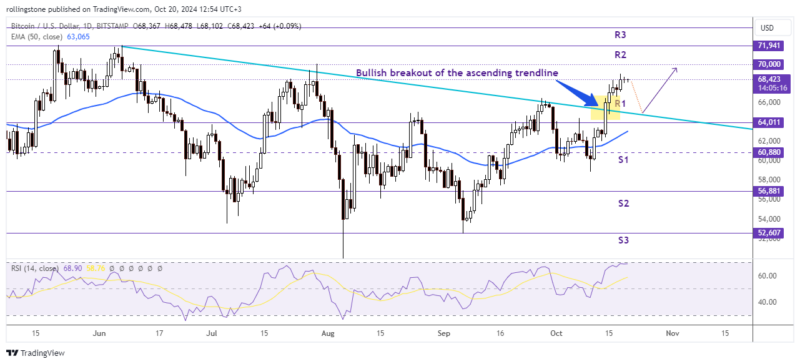
- Bitcoin price exceeds $68K following the bullish breakout of the bearish trendline on the daily chart.
- Despite the bullish momentum, the price might pull back as the RSI indicates an overbought market.
- BTC may retest the immediate resistance at $70K if the price holds above $65K this week.
Bitcoin Technical Analysis – BTC Daily Chart

Bitcoin (BTC) gained around 8% last week through Friday after breaking the trendline resistance, aiming for a new all-time high (ATH). This spike in Bitcoin’s price is being fueled by an uptick in institutional demand, which saw $1.86 billion inflows, the longest stretch of inflows since mid-July. Rising apparent demand and institutional reports indicate that the current BTC cycle is similar to the third halving when values rose dramatically.
The daily chart shows signs of strength, having broken and closed above the $66K resistance level on Tuesday. If this level remains as support, Bitcoin will continue its rise towards its July 29 high of $70,079. With a successful closing over $70,079, BTC is aiming for its next objective at the current all-time high of $73,777.
The RSI on the daily chart is ticking around 68.5, close to the overbought level of 70. If it reaches the zone on a closing basis, traders should avoid adding to their long holdings as the likelihood of a pullback increases. Another scenario is that the rally continues while the RSI remains in the overbought zone.
Key Findings: ETH Technical Analysis
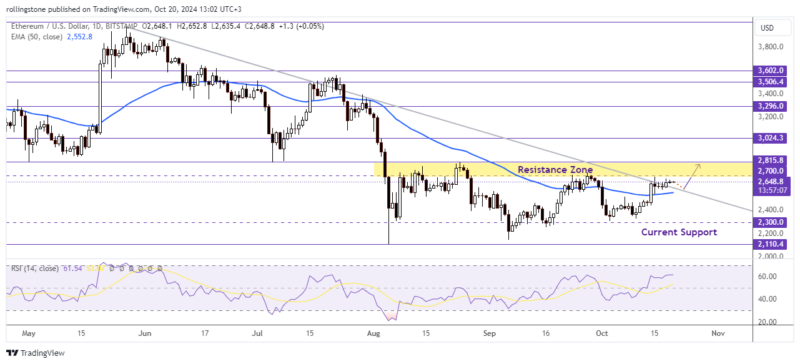
- The Ethereum price broke above the 50-EMA last week but got restricted right below $2.7K.
- The price successfully holding above the $2,500 level suggests fresh demands are in place.
- However, the market could encounter strong supplies as well once it enters the $2.7K-$2.5K zone.
See Related: Bitcoin And Ethereum Technical Analysis: BTC Targets $70K After Breaking Key Resistance, ETH Rally Stalls Below $2.7K
Ethereum Technical Analysis – ETH Daily Chart

Ethereum’s price broke the daily resistance level of $2,450 and gained 6.5% on Monday, finishing well above its 50-day EMA of $2,552. If the 50-EMA holds as support, ETH may extend the ongoing bullish rally and retest the critical resistance at $2,815.
However, Ethereum might encounter fresh supplies while entering the $2.7K-$2.8K resistance zone. In such a case, the price could pull back the descending trendline support near $2,555. From a technical point of view, ETH’s bullish momentum will remain intact until the price holds above the $2,500 level.
For a bearish outlook, a move below $2,500 will mean a break of the 50-EMA support as well, which might lead the price to retest the long-term support near $2,300.


