Key Findings: BTC Technical Analysis
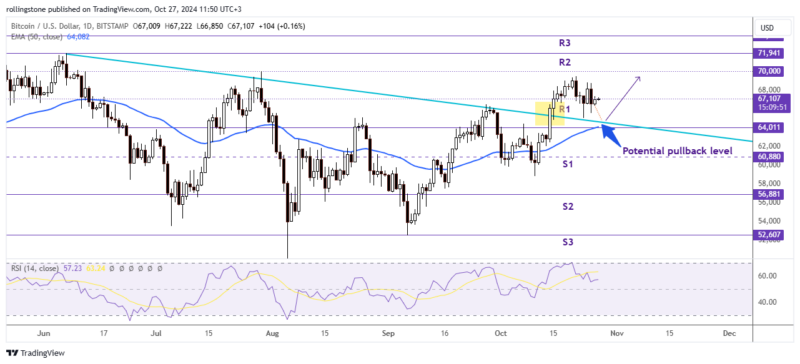
- Bitcoin has yet to decide on the upcoming market bias as the price remains within the $65K-$69K zone.
- The price rejected a move below the daily descending trendline, suggesting bullish momentum.
- BTC/USD could pull back below $65K before taking off for a potential bullish move targeting $70K.
Bitcoin Technical Analysis—BTC Daily Chart

It maintains a strongly bullish outlook, with recent price action showing more promising resiliency. During the week in review, Bitcoin reached highs of $69,500 and lows of $65,000. This kind of range-bound behavior could spell a consolidation phase, which is likely bullish if prices remain above the $65,000 threshold.
It has been driven both by the proximity of the stock market to its historical highs and by very fast-growing US debt. Of course, Bitcoin is still a speculative asset, but increasingly, more and more analysts seem to agree that it will soon develop into a safe-haven asset.
If Bitcoin stays above $65,000, it could slowly rise to the historic maximum resistance near $74,000. Otherwise, if it falls below $65,000, then prices could quickly decline to $60,000. In perspective, $60,000 can be considered a critical support level, and therefore, unless the price of Bitcoin pierces below this level, the upward prediction remains valid, albeit at different intensities. The upside momentum would be much stronger in case Bitcoin succeeded in staying above $65,000 but not that strong in case the price pierced below to $60,000.
If it falls below US$60,000, then the outlook might turn bearish, and investors will have to start being cautious. It would then test the lower supports at US$51,500 or even US$49,000.
That’s how simple it is: above $65,000, the bias of Bitcoin stays firmly bullish; above $60,000, firmly bullish, but with no such great emphasis.
See Related: $ETH Remains Bearish And May Push $1000 By January 2023 – Ethereum Technical Analysis
Key Findings: ETH Technical Analysis
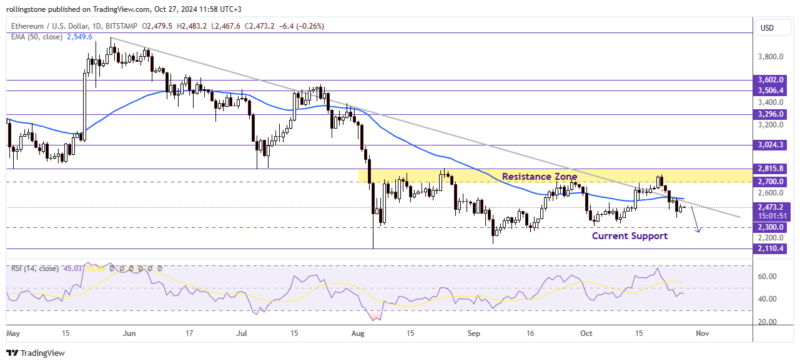
- Ethereum continues with the bearish rally as the price dives below the daily bearish trendline.
- The price also broke the 50-EMA support at around $2,556 on Wednesday.
- ETH/USD might retest the upcoming support near $2,300 if the price fails to return above $2,500.
Ethereum Technical Analysis—ETH Daily Chart

Ethereum saw a notable drop this past week, with many altcoins following in its footsteps amid a downturn in risk assets tied to rising interest rates. Investors reacted to the unexpected rate surge with unease, as many had anticipated rates would fall rather than climb.
This downward shift pushed Ethereum right to a crucial support trend line at $2,385, a level that has held firm since early August. This trend line, originating from the August 5th lows, has been tested six times now, each time providing support to the price.
However, Ethereum’s outlook remains cautious. Each additional test of this support line may erode its strength, making it increasingly fragile. Moreover, the price activity since August—oscillating between $2,800 and $2,300—has shaped a bear flag pattern, which historically suggests a greater chance of further decline.


