Key Findings: BTC Technical Analysis
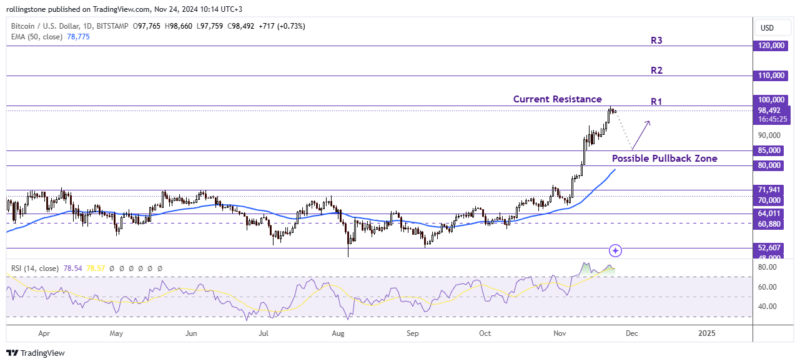
- Bitcoin is approaching the $100,000 milestone, with the potential to reach $120,000 by 2025 amid growing investor confidence.
- Indicators like the RSI and Bollinger Bands indicate that the pair is overbought and might pull back temporarily.
- Resistance is expected at $99,000, with minor support at $91,000 and $85,000 that could soften further losses beyond these levels.
Bitcoin Technical Analysis

Bitcoin is slowly getting on track for its historic feat with slow inches in price into the $100,000 mark. If the optimistic trend keeps improving, the jumps might take the price to as high as $120,000 by 2025.
At the time of writing, Bitcoin changes hands at circa $98,000, with leading technical indicators pointing to suggest the cryptocurrency is biased to the upside. However, many are still skeptical as other indicators suggest the current rally may be resisted. The RSI is well in the overbought region, which indicates high buying pressure. Also, the price of Bitcoin has managed to break above the upper Bollinger Band, a standard gauge of overstretching that often sets the stage for price retracements.
Major psychological and technical barriers are currently in focus among traders and investors as the Bitcoin price is inching closer to the key $100,000 level. Some analysts believe that the $99,000 level could increase selling pressure and provide a short-term barrier for buyers to achieve new all-time highs, while major supports have been identified at $91,000 and $85,000, which may prove to be important zones to catch any pullback in prices.
While optimism remains high over Bitcoin’s trajectory, the dynamics in the market would indeed suggest that traders should expect possible corrections in the short term. The ability to achieve and sustain new price levels will more than likely depend on broader market conditions, regulatory developments, and continued institutional interest.
As Bitcoin nears 100,000 dollars, one must get into the market with tempered optimism—a little balance between high-flying bullish ambitions and pragmatic risk management.
Key Findings: ETH Technical Analysis
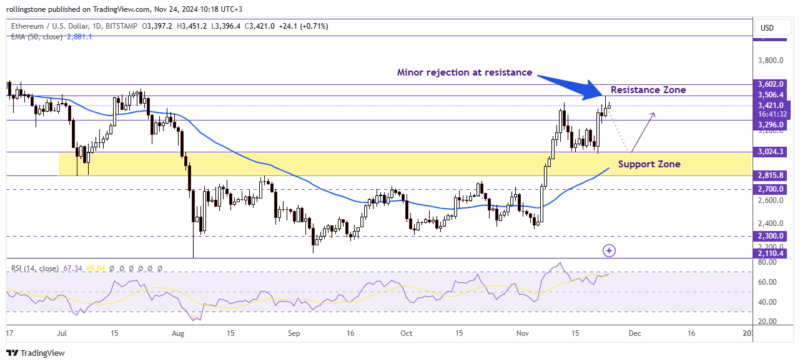
- Ethereum surges more than 9% to trade above $3,421, closing in on the key resistance of $3,506.
- The RSI of Ethereum is at 68, well above the 61.8% Fibonacci level which shows strong upward momentum, though tending towards overbought conditions.
- A close above $3,506 will open up the possibility of moving up to $4,000, failing which will trigger a fall toward the support at $3,000.
Ethereum Technical Analysis

Ethereum continued its uptrend, adding over 9% on Thursday, and then held its breath into Friday, changing hands over $3,421. The cryptocurrency is getting close to a pivotal weekly resistance at $3,506, from where the course for the following days will be decided.
With the recent rise, Ethereum has climbed above the 61.8% Fibonacci retracement at $3,300, which was considered important for structural development and thus closely watched by traders tracking major technical formations. The RSI on the daily chart is now 68 above its midpoint of 50. The uptrend implies increasing momentum to the upside as the RSI inches closer to overbought territory.
A confirmed breach and close above $3,506 might, in this regard, allow Ethereum to make an attempt closer to $4,000, which is a reasonable milestone that will further cement its upside case. Failure to scale through it, might see a pullback correction in its price. Analysts believe $3,000 is strong support and might act like a cushion in case of a pullback.


