
Key Findings: BTC Technical Analysis
- BTC falls below $80K, down 30% from ATH, wiping $660B from the market.
- $2.48B ETF outflows, with BlackRock & Fidelity offloading BTC.
- If Bitcoin falls below $80K, it could drop to a further downside target near $73K.
Bitcoin Technical Analysis
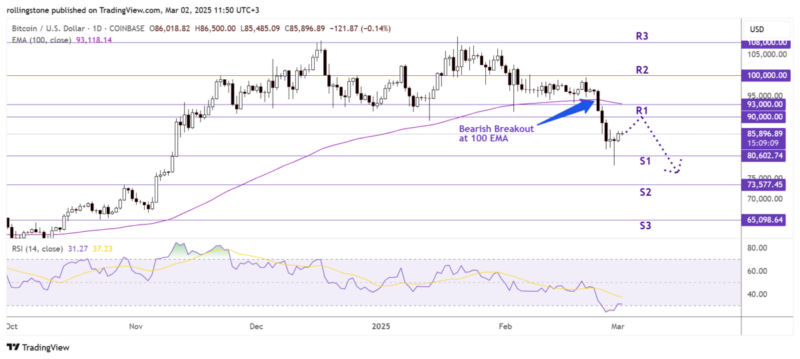
Bitcoin is still under intense selling pressure, trading below the key $80,000 support level, 30% off its ATH of $109,588. The overall crypto market has shed $660 billion in total market capitalization, with Bitcoin liquidations totaling $1.75 billion. Institutional outflows, ETF redemptions, and macro uncertainty are fueling the downtrend, raising the prospect of a decline to $73,000 if BTC fails to hold $80,000.
Institutional players continue to sell off BTC holdings at a furious clip, with US Bitcoin spot ETFs seeing $2.48 billion in net redemptions this week alone. Industry heavy-hitters such as BlackRock, Fidelity, and Ark Invest have been found to have sold off significant quantities of BTC, with BlackRock alone sending 5,100 BTC to Coinbase, suggesting a $400 million liquidation. In contrast, the Crypto Fear & Greed Index has fallen to 10 (Extreme Fear), a position that has historically been a precursor to potential market reversals.
BTC stands at a fork in the road. Failing to retake $85,000 risks a further correction down to $73,000, a significant support. But RSI 20 indicates extremely oversold conditions and the potential for a bounce. Traders need to closely monitor ETF flows, institutional behavior, and macrotrends to decide on Bitcoin’s direction next. Will BTC move further down, or is a trend reversal imminent? The next few weeks will be crucial.
See Related: Bitcoin And Ethereum Technical Analysis: BTC Moves Below $64K Following An Unsuccessful Test of The 50-EMA
Key Findings: ETH Technical Analysis
- Large holders dumped 620K ETH in five days, pushing exchange reserves up by 500K ETH.
- Ethereum futures saw $231.69M in liquidations, with RSI and MACD signaling further downside.
- A drop below $2K could see ETH test $1,500, while a breakout above $2,850 may spark a recovery.
Ethereum Technical Analysis
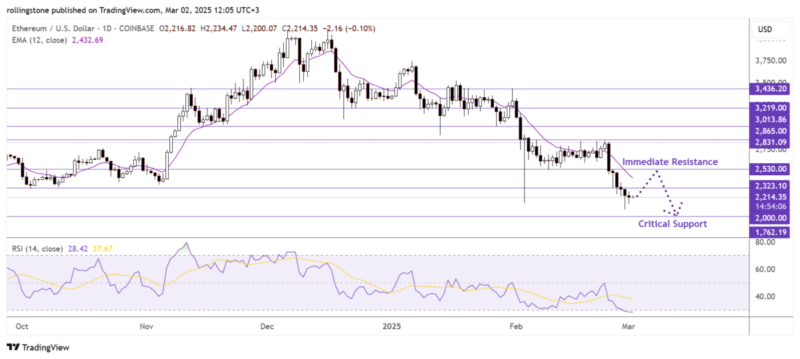
Ethereum is facing intense bearish pressure, trading close to the $2,200 support after declining by 20% in the last week. Whales and institutional investors have sold more than 620K ETH within five days, contributing 500K ETH to exchange reserves. The selling spree has ETH trading close to the $2,000 psychological support, with fears of additional losses.
Ethereum futures have also been affected, with $231.69 million liquidated in 24 hours, a sign of poor market sentiment. Technical indicators RSI and MACD are still below neutral, a sign of continued bearish momentum. The stochastic oscillator, however, presents an oversold level, which may signal a bounce if buying pressure increases. Should Ethereum (ETH) fall short of sustaining the $2,200 mark, the fall to the support of $1,500 reached in October 2023 becomes automatic.
Notwithstanding the recent selling pressure, the medium-term path of Ethereum depends on upcoming developments, most notably the forthcoming plans of the Ethereum Foundation. A weekly close above $2,850 can render the bearish trend invalid and ignite a rally. Traders need to monitor whale activity, exchange flows, and overall market trends closely to predict ETH’s next step.