XRP Quick Facts
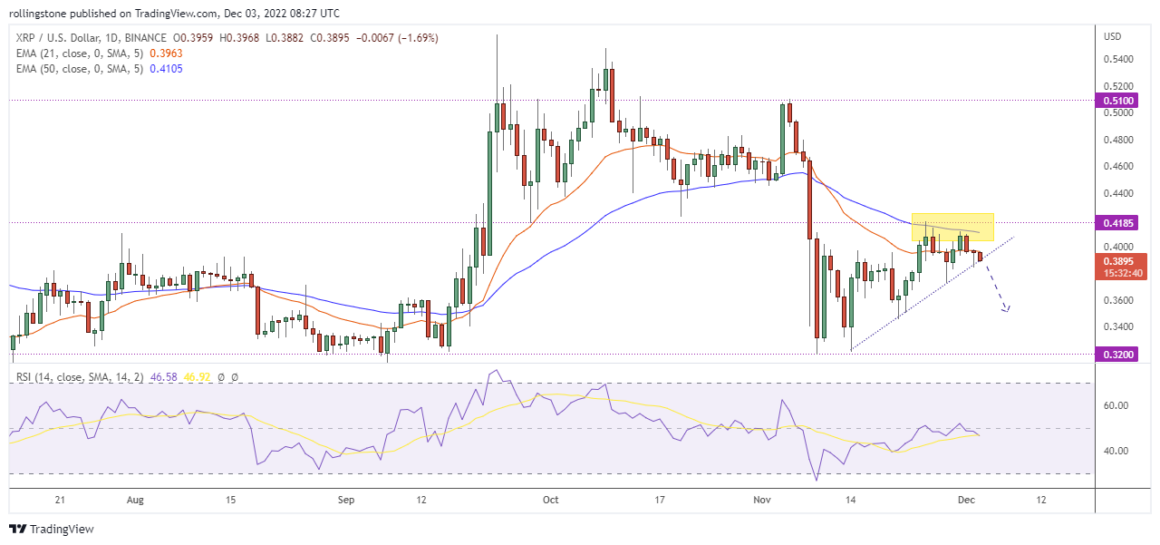
- The 21 EMA remains below the 50 EMA, indicating the price is under a solid downtrend.
- The price retraced near 0.4185 but failed to break the resistance to revive the recent bullish momentum.
- RSI is below 50 and moved below the 14 SMA, suggesting a further bearish movement.
- XRP may rejoin the downside rally and hit the long-term support near 0.3200 within December 2022.
- If Ripple jumps above the current resistance and returns to a bullish trend, the price will still have to deal with the critical resistance at 0.5100.

Ripple (XRP) Technical Analysis
Ripple (XRP) entered a deep consolidation mode since the price was rejected at 0.4185 on November 25th. The technical analysis on Ripples daily chart prints a potential double-top pattern right below the current resistance, indicating a further bearish movement.
A bearish crossover between 21 and 50 EMA (Exponential Moving Average) also suggests a downtrend condition. The price was rejected from the 50 EMA and currently holds below the 21 EMA.
Despite the recent bullish momentum, RSI (Relative Strength Index) value failed to hold above 50 and dropped below the 14 SMA (Simple Moving Average), indicating ongoing bearish momentum.
The price is now testing trendline support on the daily chart. A break below this trendline may validate the potential double-top pattern and accelerate the bearish rally.
According to our analysis, the potential downside target for XRP remains near the long-term support at 0.3200. Contrarily, the price must exceed the 50 EMA and the current resistance at 0.4185 to sustain a bullish reversal.
See Related: Chainlink (LINK) Price Prediction For December


