Key Findings: $CSPR
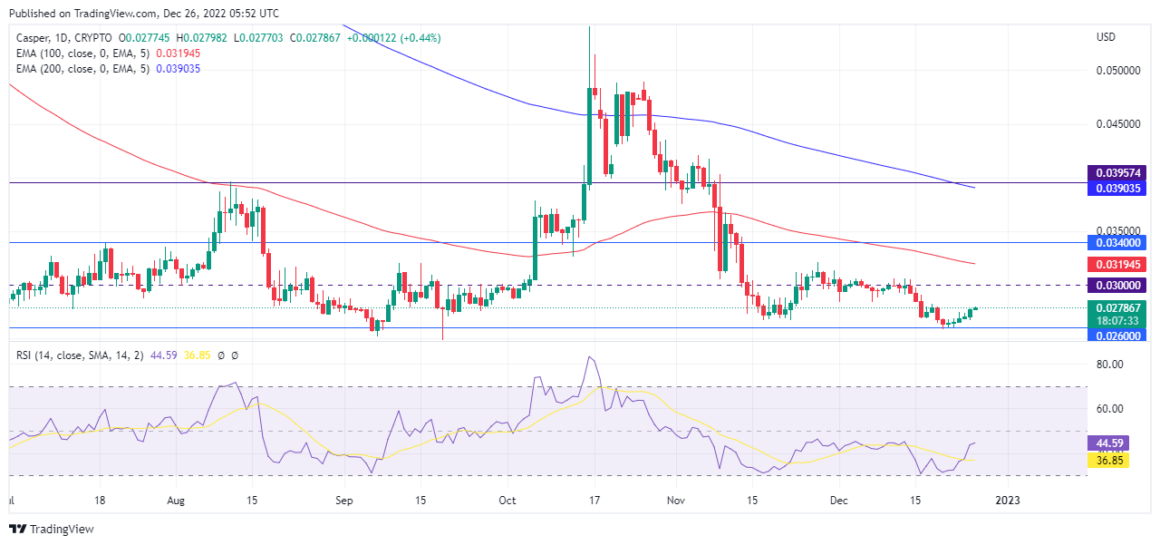
- Casper’s price rejects the support at $0.0260 for the third time since September 7 and keeps moving within the short-term bullish momentum.
- The upcoming resistance remains at the $0.0300 mark, a psychological barrier against the current upside rally.
- The 100 and 200 EMA suggests CSPR is still under the long-term bearish trend despite the current bullish sentiment.
- The RSI moves above the 14 SMA but is yet to exceed 50 to confirm a bullish trend.
- If Casper breaks above $0.0300, we may see more supply awaiting near the 100 EMA (0.0319) and the resistance at $0.0340.

Casper (CSPR) Technical Analysis
CSPR revives above $0.0260 despite the overall bearish trend. The price initiated a short-term bullish move followed by the rejection of the current support.
Expecting a further price surge at this point will be a counter-trend move since the 100 EMA still maintains below the 200 EMA, suggesting a long-term downtrend.
However, Casper is denied by the support at $0.0260 for the third time in the last three months, which indicate a bullish correction is underway. If the price manages to hold above the support, we may see CSPR retesting the upcoming psychological resistance at $0.0300 before the year ends.
If Casper exceeds $0.0300, we’ll closely watch how the price reacts near the 100 EMA ($0.0319) and the long-term resistance at $0.0340 for assessing any potential bearish trend reversals.
The RSI indeed exceeds the 14 SMA, but the index value must rise above 50 to validate the current bullish momentum.
See Related: Binance Coin Bullish Rally Stalls Below The Current Resistance $253 – BNB Technical Analysis


