Polkadot: Key Findings
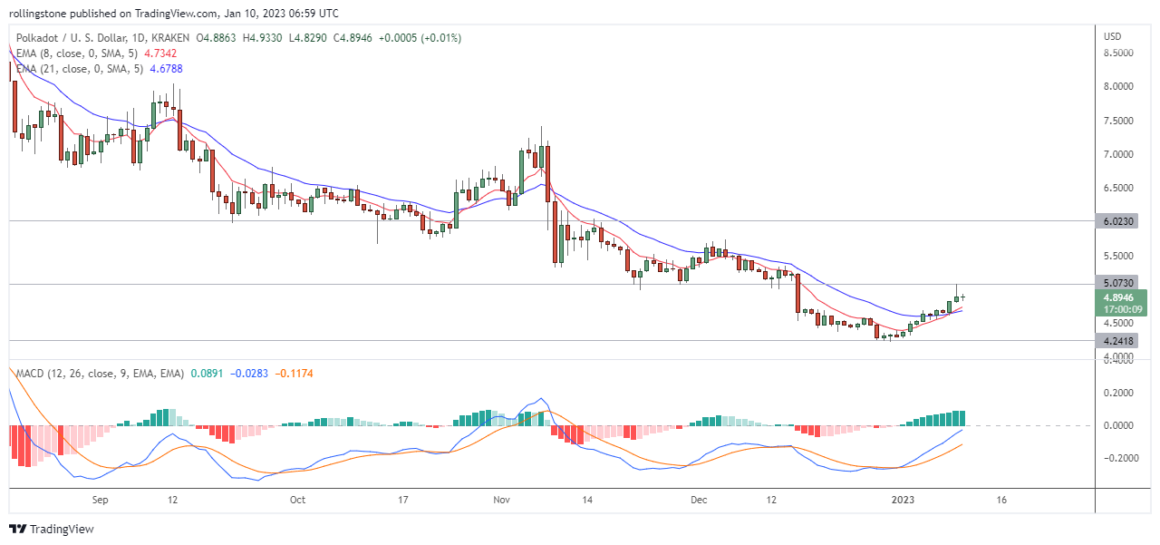
- The technical analysis on Polkadot found an upcoming resistance to look at $5.0730 and $6.0230.
- $DOT reversed for a bullish move since the price got rejected at support near $4.2418.
- The 8 EMA exceeds the 21 EMA, indicating a bullish crossover.
- The price holds above the EMA levels following the current uptrend.
- MACD signals a strong bullish momentum.

Polkadot (DOT) Technical Analysis
Polkadot has returned near $5.0730 and may retest the resistance as the price shows more strength within the current bullish momentum.
According to the daily chart, DOTUSD started the new year 2023 with a steady uptrend following the rejection at support near $4.2418. The price now holds above the dynamic resistances (8 & 21 EMAs), showing a better bullish strength.
See Related: Polkadot’s Development Activities Hit An All-time High
Most importantly, the 8 EMA has just moved over the 21 EMA, plotting a bullish crossover. This crossover signal will remain valid until the price holds above the EMA supports.
Furthermore, the MACD bars are rising, indicating a bullish momentum is getting stronger. Also, the MACD value rises above the signal line, which signals an uptrend ahead.
Technically, Polkadot will remain bullish until the price holds above the 21 EMA. Besides, we may see DOTUSD retests and breaks the immediate resistance at $5.0730 to continue with the current upside rally targeting $6.0230.
This is not investment advice or financial advice, and any investment decision must be taken with precaution.


