Key Findings: BTC Technical Analysis
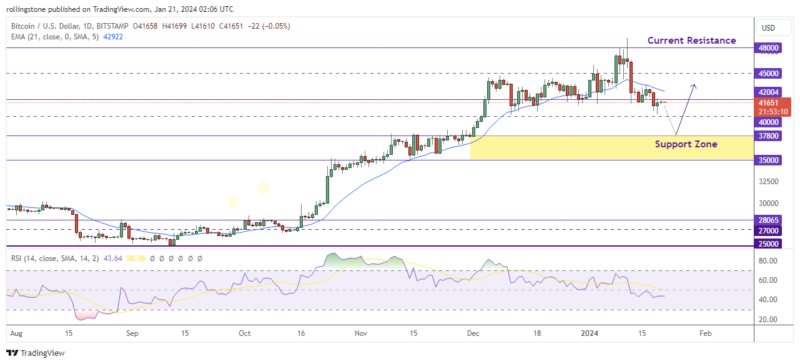
- Bitcoin price action dropped to $40,600 overnight, over 20% below last week’s high.
- The RSI at 43.81 signals a bearish momentum despite the price closing above $41,500.
- We might see BTC retesting below the $38K zone if the price fails to return above the resistance at $42K.
Bitcoin Technical Analysis – BTC Daily Price Chart

Most technical analysts noted the shooting star candlestick formation on the weekly timeframe from last week, which formed off resistance at $45,968, which also happens to share chart space with a 1.272% Fibonacci projection ratio (also called an “alternative” AB=CD bearish pattern). Due to this, follow-through selling started to occur last week, and it has now created room for more underperformance up to the weekly support level of $37,800.
The Relative Strength Index (RSI) has dropped to 43.81, suggesting the price already entered into a short-term bearish momentum. If BTC fails to sustain above the $40K level, we might see the price retest the critical support zone highlighted from $37,800 to $35,000.
For a bullish outlook, the price must sustain above the current support at $42K and exceed the immediate resistance at $42,000 to revive the bullish momentum and retest the weekly high of $49,048. A bullish breakout at this level will push the BTC/USD price for a further gain above the psychological barrier of $50K.
See Related: Bitcoin And Ethereum Technical Analysis
Key Findings: ETH Technical Analysis
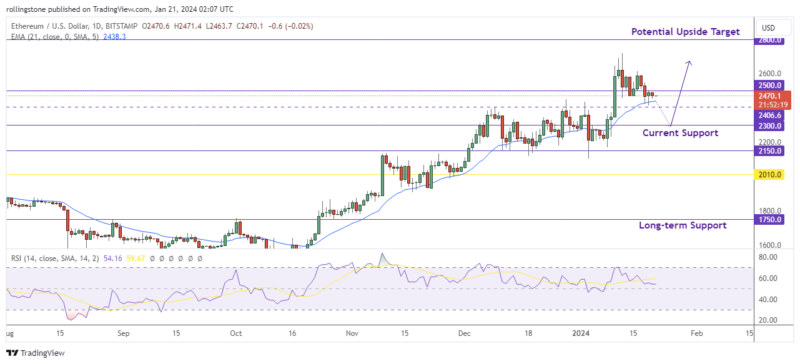
- Ethereum price consolidates within a narrow range of $2,500 and $2,400.
- The price plotted a false break at 21 EMA, indicating ETH will resume the recent bullish move.
- We might see the price retest the current support before rejoining the upside rally, targeting $2,800.
Ethereum Technical Analysis – ETH Daily Price Chart

Over the previous week, Ethereum’s price has fluctuated sideways between $2,400 and $2,600. The altcoin had dropped today but has now recovered above the $2.4K support. Ether is heading back toward the $2,600 and $2,700 recent highs.
ETH/USD might reach a high of $3,000 if buyers break through the resistance level at $2,700. Currently, it is trading above the 21-day EMA or $2,400 support line. If the present support levels are broken, the biggest altcoin could see a further correction, pushing the price inside the $2,300 – $2,150 support zone.
Alternatively, a bullish breakout above the $2.5K resistance will re-activate the overall bullish momentum. In such a case, we’ll set $2,800 as the next upside target for Ethereum.


