Key Findings: BTC Technical Analysis
- Bitcoin surged to a record $99,588 but retraced 7%, dipping to $90,791 by midweek.
- The RSI at 65 hints at continued upward momentum.
- A recovery could push Bitcoin back to $99,588, while further declines might test the critical $85,000 threshold.
Bitcoin Technical Analysis

Last week, BTC/USD hit an all-time high of $99,588 before beginning to decline. BTC fell 7%, reaching a low of $90,791 by Tuesday. However, it did recover marginally on Wednesday. At the time of writing on Friday, it was trading about $97,000.
If Bitcoin continues to recover, it might rise to its all-time high of $99,588. The daily chart’s Relative Strength Index (RSI) indicator is 65.47, which is above its neutral level of 50, suggesting bullish momentum. However, traders should exercise caution because the Moving Average Convergence Divergence (MACD) produced a bearish crossover on Tuesday, indicating a sell signal.
If BTC fails to recover and the pullback continues, it could extend the decline to retest its important psychological level of $85,000.
See Related: Bitcoin And Ethereum Technical Analysis: BTC Signals To Hold Above $70K This Week
Key Findings: ETH Technical Analysis
- Ethereum gained 9.8% midweek, closing above $3,506 before settling near $3,602 on Friday.
- With an RSI of 69.47, ETH signals strong upward momentum while staying below overbought levels.
- Holding $3,506 as support could see ETH retesting $4,000 while losing it might drive the price toward $3,000.
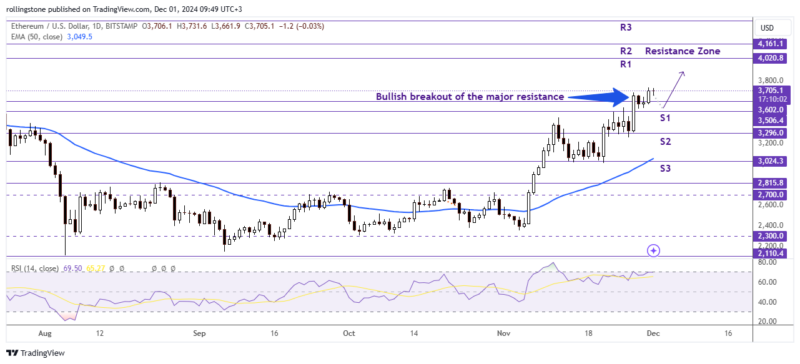
Ethereum Technical Analysis

On Wednesday, the Ethereum price climbed 9.8% and finished above the weekly barrier level of $3,506. However, on Friday, it was trading slightly lower, around $3,602. If $3,506 maintains as support, ETH might rebound and retest the psychologically significant $4,000 barrier.
The RSI on the daily chart is 69.47, above its neutral threshold of 50, signaling that bullish momentum is gathering pace well below overbought levels.
If ETH falls below $3,506, it may have a retreat to retest the support at $3,000. Otherwise, rebounding above this support and moving north will be considered a pullback/retracement of the ongoing bullish trend. In such a case, we might see traders adding more long positions in between the $3.5K and $3.6K zone targeting the psychological resistance near $4,020.


