Key Findings: BTC Technical Analysis
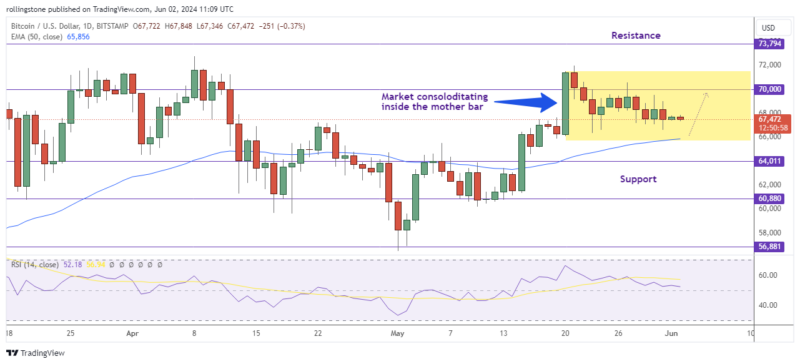
- Bitcoin price initiated a consolidation move after failing to exceed the resistance at $70K.
- The price might encounter solid support near 50-EMA and the current mother bar low at $66K.
- A break below the 50-EMA might inspire sellers to push the price to a further downside target near $60K.
Bitcoin Technical Analysis – BTC/USD Daily Chart

Short-term bitcoin (BTC) price movement is being monitored by technical indicators, which have turned negative and placed critical support near $66,000.
The important support to look out for is the fundamental 50-day exponential moving average at $65,857. If the U.S. inflation numbers, which are expected later on Friday, outperform expectations, there would be a greater chance of a decline toward the same.
According to the daily price chart Bitcoin initiated a sideways movement since the price failed to break the immediate resistance at $70K on May 21. However, the price might still find support near the 50-EMA as the relative strength index remains above 50 (52.30).
A break above the resistance at $70K could resume the overall bullish momentum. On the other hand, a move below the $66K level might begin a bearish momentum aiming at $60K as a potential downside target.
Key Findings: ETH Technical Analysis
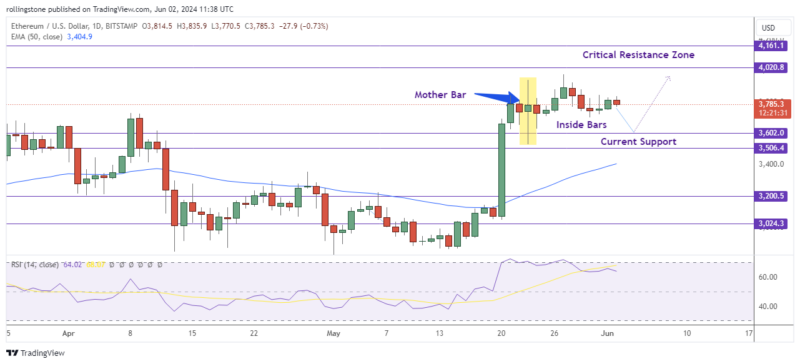
- Ethereum began sideways movement between $3.9K and $3.5K on May 23.
- The price is under a short-term bearish momentum following the failure to retest above the $4K zone.
- We might see ETH/USD moving to the $3,200 – $3,024 zone if it fails to survive the current support at $3,506.
See Related: Bitcoin And Ethereum Technical Analysis
Ethereum Technical Analysis – ETH/USD Daily Chart

On Friday, Ethereum’s price was hovering around $3,740, continuing its sideways movement. With $16.66 million in liquidated long holdings and $12.12 million in liquidated short positions, the ETH liquidations data also showed the balance between bulls and bears.
Despite the current market consolidation, ETH is still under an overall bullish trend initiated since mid-May. However, the RSI rebounding from the overbought level (above 70) indicates a possible short-term price correction.
In case, the market decides to pull back, we might see the price retest the support at $3,506 before deciding on the upcoming market bias. A break below this level will put the price at risk of a further decline near $3,024.
Alternatively, a bullish breakout of the current resistance at $4K will inspire buyers to push the price toward the next resistance near $4,385.


