Key Findings: BTC Technical Analysis
- With a quiet weekend predicted before an exciting week beginning on Monday, the Bitcoin price is now trading inside a tight range.
- BTC has historically had a 20%–25% decline as part of the instant post–halving correction.
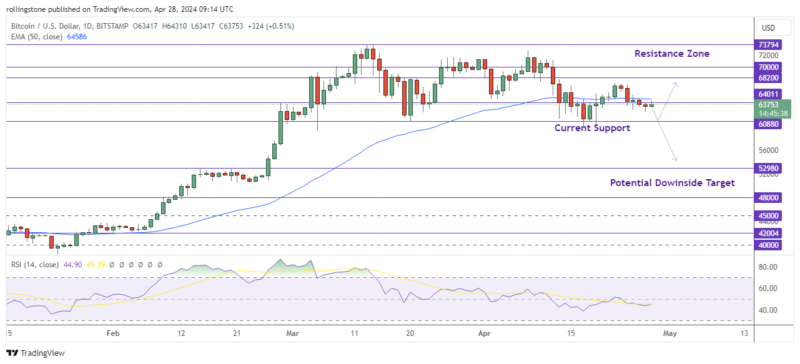
- The BTC/USD would enter the liquidity pool between $60,880 and $52,980 with a 20% decline from the $73,777K ATH.
Bitcoin Technical Analysis – BTC/USD Daily Chart

After the halving event ended on April 19, BTC/USD had been recovering gradually but steadily, wiping out a large portion of its recent decline. However, given that the price was unable to overcome the 50-day SMA, the rebound looks to be on hold for the time being.
If Bitcoin reverses downward, the 62,500 mark from March could thwart early attempts to decline. If the price dips below that level, it may test 60,760 before 59,313—both of which have shown strength in March. A breach of the latter might pave the way for the 52,850 resistance zone in February.
Conversely, should buying pressures resurface, the market may return to its previous resistance level at 67,270, which also happens to coincide with the 50-SMA. Once the bulls take control of that zone, they may go for 69,000, a level that has recently served as both support and resistance. A rupture above that area might open up the 71,750-point March resistance.
See Related: Bitcoin And Ethereum Technical Analysis: BTC Sets 69K As A Deciding Zone For The Upcoming Market Bias
Key Findings: ETH Technical Analysis
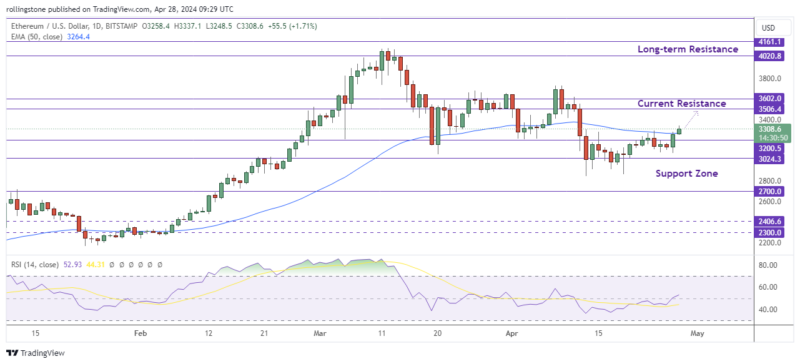
- Ethereum price initiated a bullish breakout above the 50-EMA after the price transformed the resistance at $3,200 into support.
- However., ETH longs could suffer as inside sources tell Reuters that the SEC would most likely deny a spot ETH ETF.
- A daily candle closing above $3,200 can lead ETH/USD to test the upcoming resistance at $3,506.
Ethereum Technical Analysis – ETH/USD Daily Chart

Thursday appears to be the start of Ethereum’s consolidation after a 24-hour decline. The amount of long liquidations started to rise once more, reaching $35.1 million in the previous day.
Given that ETH has been trading in this range for the last 13 days, the $3,024 to $3,200 range looks to be very robust, both at the top and lower ends. Since spot ETH ETFs seem improbable with each fresh piece of information, ETH may stay inside the range given the recent decrease.
But in the near run, ETH’s movement will still be determined by changes in Bitcoin’s price. Given its recent indication of a rally before the dip, ETH may likely witness larger price gains if Bitcoin maintains its upswing. Since the price of Ethereum seems to have already been factored in, an SEC spot ETH ETF refusal may not necessarily cause the price to rise.


