Key Findings: BTC Technical Analysis
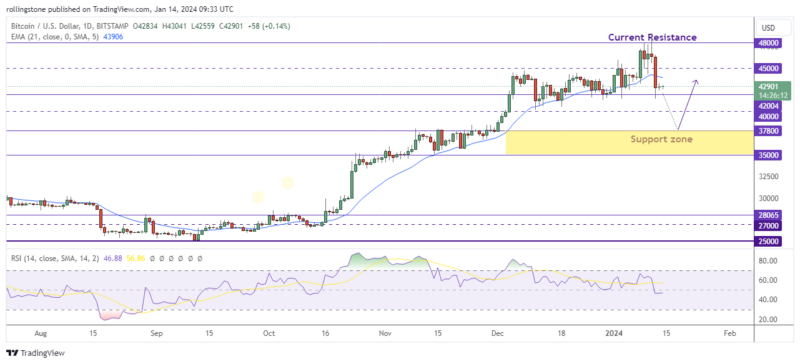
- Bitcoin price was firmly rejected from the resistance at $48,000 while attempting to move towards the $50K zone.
- The price now finds support around the $42,000 level but breaks the 21 EMA support at $43,906.
- If the current support is broken, BTC/USD may dive below the $40K zone for another price correction.
Bitcoin Technical Analysis – BTC Daily Price Chart

Following the much-awaited certification of many ETFs, including Bitcoin, as ETFs, the cryptocurrency has surged to the long-term critical Fibonacci retracement point of 61.8%. Most traders know that trading within a 61.8 retracement, much less a long-term weekly one, is risky, particularly in light of the diverging relative strength, or RSI. While we would anticipate buying on dips, investors who wish to go long following a significant “news event” at a pivotal level ought to exercise caution.
The price of Bitcoin is testing the bottom limit of the advancing parallel channel under increasing selling pressure, and if buying momentum keeps dropping, there may be a prolonged slide. The bears are solidifying their hold on Bitcoin as the RSI plummets.
BTC Analysis (Long-Term Uptrend)
However, the long-term uptrend of BTC/USD will change if the price breaks below the $35K level. Otherwise, the price still holds on to the bullish momentum and shows probabilities of bouncing upwards from the $42K – $40K zone. In such a case, we’ll closely examine how the price reacts when it retests the current resistance near $48,000.
See Related: Bitcoin And Ethereum Technical Analysis
Key Findings: ETH Technical Analysis
- As the price of Ethereum exceeded $2.7K, traders shifted their money to the alternative coin.
- The SEC’s approval of Bitcoin ETFs probably increased market participants’ expectations of Ethereum ETF approval.
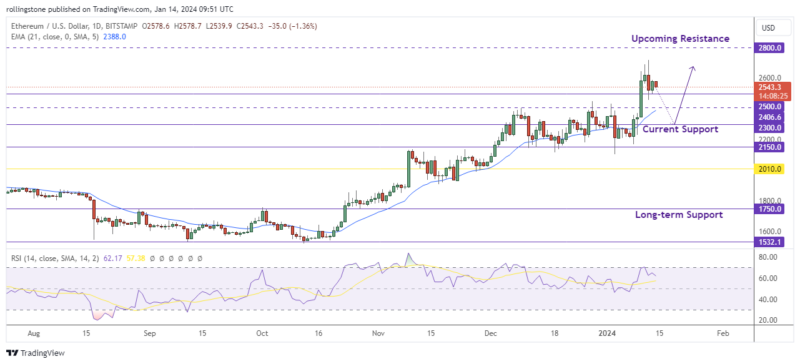
- ETH/USD is under an overall bullish trend and may hit the $2,800 level if the price holds above the $2,500 support.
Ethereum Technical Analysis – ETH Daily Price Chart

The price of Ethereum reached a high of $2,600 on the first day of Bitcoin Spot ETF trading. Given the possibility that the Ethereum Spot ETF may be approved in May 2024, capital may be shifting from BTC to ETH and other cryptocurrencies.
Ethereum price broke the resistance at $2,500 on January 10 and is still holding above the level following the overall bullish momentum. However, the RSI hits the overbought zone at 70, and a deeper pullback is still possible.
If ETH/USD decides for a further retracement below $2,500, we may see the price find support at $2,300 and resume the bullish move targeting the $3K level.


