Key Findings: BTC Technical Analysis
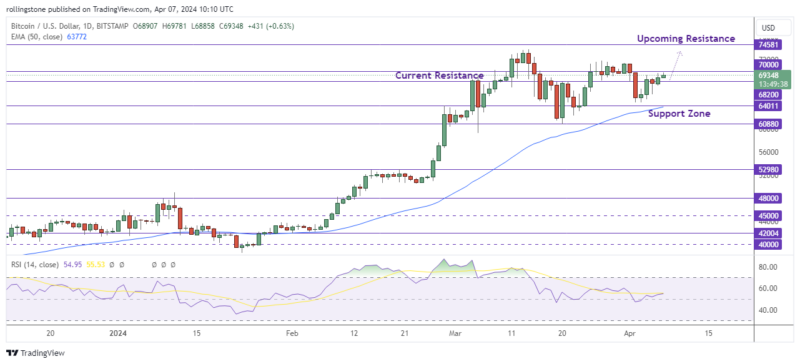
- Since March 2024, the Bitcoin price has fluctuated in the $73,777 to $60,700 range.
- The price remains above the 21 EMA with the RSI above 54 to signal a bullish market bias.
- Bitcoin price must reclaim its position above the $70K level to revive the recent bullish momentum.
Bitcoin Technical Analysis – BTC/USD Daily Chart

Bitcoin continues to lead crypto markets, having the effects of its strength and weakness felt throughout the sector in turn. As the market heads into the weekend, fresh volatility is expected to rise as trade volumes fall to end another typical of the weekend.
BTC is trading above the weekly demand zone of $58,375 to $65,518. It has immediate support from the 200-day EMA. If the bulls can push BTC above $69,000, it might spark additional purchasing pressure, allowing BTC/USD to reclaim its peak at $73,777.
In a strongly bullish scenario, Bitcoin’s price may surpass its peak and reach $75,000.
The Relative Strength Index (RSI) is well above the 50 mean level, which is supported by the Awesome Oscillator and MACD indicators, both of which are positive.
Bitcoin will carry a bullish sentiment until the price holds above the 50 EMA line. Buyers will target the $64K – $60K zone to enter long positions and rejoin the bullish rally. However, a bullish break of the $69K – $70K resistance zone will push the price to retest the $75K level without a further pullback.
See Related: Bitcoin And Ethereum Technical Analysis: Bitcoin Signals A Deeper Correction Near $60K
Key Findings: ETH Technical Analysis
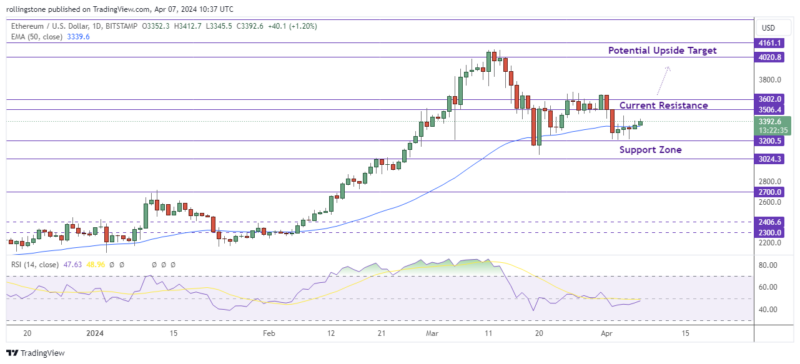
- Ethereum price keeps consolidating inside the $3,506 and $3200 zone since 2nd April.
- Recently the price plotted a double bottom pattern on the 50 EMA support line, indicating another bullish wave.
- A bullish breakout above the resistance at $3,600 could establish the upside momentum and lead the price to retest the resistance at $4,020.
Ethereum Technical Analysis – ETH/USD Daily Chart

Ethereum’s price has largely remained unchanged over the last three days, as traders remain undecided over whether to be bullish or negative. However, there is a possibility of change shortly, since Bitcoin’s fourth halving event is just a few days away, and Ethereum’s price movement is heavily correlated with that of Bitcoin.
The price continues moving considerably above the newly formed ascending parallel price channel and on top of the ascending trendline. If the ETH price successfully bounces above this technical formation, it could reach the psychological level of $4,000 or higher.
Alternatively, if the Ethereum price continues to decline, the cryptocurrency may fall back into the channel. A break and closing below the top boundary of the ruling chart pattern would slow the uptrend. To invalidate the overall bullish sentiment, ETH/USD must break the long-term support at $2,500 and close below the level.


