Key Findings: BTC Technical Analysis
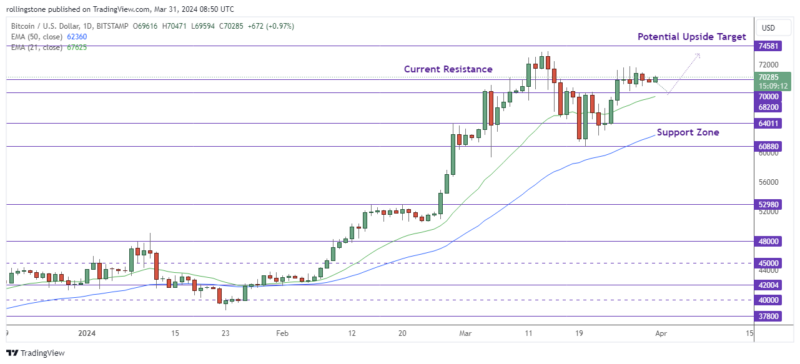
- Bitcoin price consolidating around $70K appears as a deciding zone for the upcoming market bias.
- As sell signs intensify, there is still a significant chance of a fall below $60,000.
- A bullish breakout of the $74,581 level will invalidate the short-term bearish outlook for Bitcoin.
Bitcoin Technical Analysis – BTC/USD Daily Chart

A careful inspection of Bitcoin’s oscillators reveals a mostly neutral to optimistic attitude among traders. The relative strength index at 55, coupled with other indicators such as the commodities channel index (CCI) and the average directional index (ADI), indicates that the market is in equilibrium and waiting for directional signals.
However, the amazing oscillator and momentum indicate underlying buying demand, which contrasts with the bearish signal from the MACD level, highlighting the market’s intricacy and traders’ cautious optimism.
Bitcoin’s fourth effort to exceed the $71K level this week failed. As a result, the price encountered significant resistance, stopping the bulls from mounting an onslaught. The $69.5K to $68.5K levels pique our interest. Without sufficient backing from purchasers, the correction might spread globally.
At present, BTC/USD is hovering above $70,000, with BTC holders keeping an eye on the recent peak at $73,777 and the resistance at $74,581, which, if recaptured, might revive the upward trend, driving the price near $80K.
See Related: Bitcoin And Ethereum Technical Analysis: BTC Likely To Reclaim $70K Following Major Bullish Breakouts
Key Findings: ETH Technical Analysis
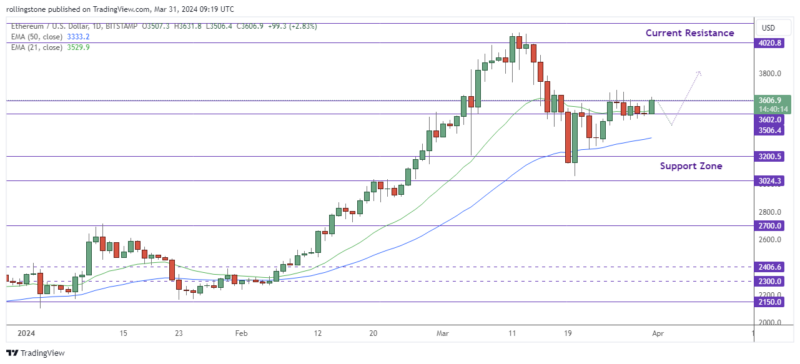
- Ethereum price keeps consolidating between $3,681 and $3,423 for the last seven days.
- The price holding above the resistance at $3.6K signals further gains this week.
- ETH might pull back near the $3,324 – $3,200 zone if the price fails to sustain above $3.5K support.
Ethereum Technical Analysis – ETH/USD Daily Chart

The Ethereum price is now drifting just below $3,700 as the cryptocurrency world awaits the SEC’s verdict on whether ETH is a security. However, the price holding above the current resistance at $3,610 indicates it still holds the bullish momentum.
On the downside, Ethereum’s price may return to $3,200 and regain liquidity before continuing its upward trend. This is heavily reliant on Bitcoin price behavior, as the two coins are strongly correlated: if BTC falls below $70K and shows further weakness, ETH may also experience a correction.
However, if bulls drive Ethereum’s price over $3,610 and the daily candlestick closes above this level, which corresponds to the 50% Fibonacci level, the bearish outlook may be disproved. In such a circumstance, the altcoin might approach the year-to-date top and the weekly resistance at $4,020, representing a nearly 14% increase from current prices.


