Key Findings: BTC Technical Analysis
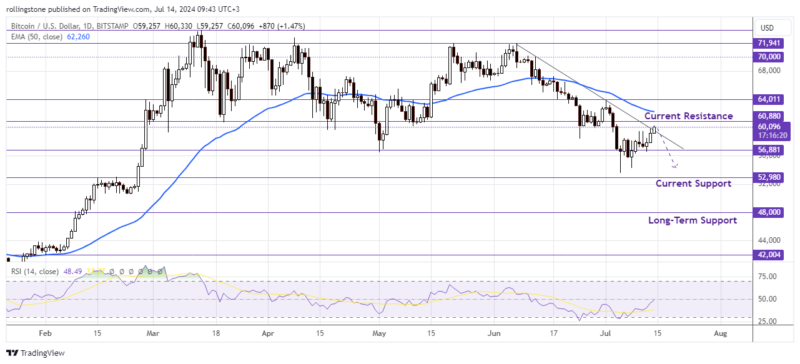
- Bitcoin price exceeded a trendline resistance on the daily chart following bullish momentum.
- The price will still be considered under an overall downtrend until the cost exceeds the resistance above $60K.
- A break below the support at $56.8K might push the BTC price to the critical support near $50K.
Bitcoin Technical Analysis – BTC/USD Daily Chart

The main storyline surrounding Bitcoin last week was unchanged from the previous two weeks: the German government’s aggressive selling.
Trades anticipated the German government might eventually try to sell the digital commodity, but they needed to figure out when or how. This was after the authorities seized almost $50,000 in Bitcoin ($3 billion) from an unlicensed streaming website earlier this year.
Bitcoin price was unable to confirm breaking below the $56,881 level. Instead, it bounced bullishly and approached the critical resistance level near $60,880.
As a result, it remained trapped between both levels, which stand in for the next trend keys, and it had to breach one of them in order to identify the next destination.
From a technical perspective, breaking the support could lead the price to revert to the primary bearish trend and hit negative targets at $52,980.
On the other hand, breaking the resistance is essential to creating a bullish wave and achieving gains that will take the price from $60K to $64K, which are the main positive stations.
See Related: Bitcoin And Ethereum Technical Analysis
Key Findings: ETH Technical Analysis
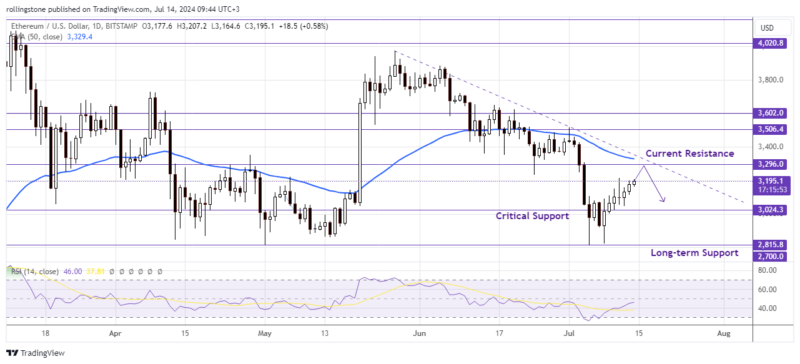
- Ethereum initiates bullish momentum after plotting a false-break of the support at $3,024.
- The upcoming resistance at $3,296 could be a deciding level for the forthcoming ETH/USD trend.
- ETH must break above the daily trendline resistance above $3K to change the overall downtrend market sentiment.
Ethereum Technical Analysis – ETH/USD Daily Chart

Ethereum price managed to establish a bullish momentum against the overall bearish trend, with a short-term range formed between the $3,296 resistance level and the $2,815 support level. Until that range breaks in one way or another, the near-term picture is neutral.
The RSI at 46.99 (below 50) is yet to confirm a bullish trend. Besides, there is a bearish trendline that intersects the immediate horizontal resistance which needs to be broken to shift the overall market sentiment to a sustainable bullish trend.
If ETH fails to break the resistance at $3,296, we might see the price rejoin the bearish trend and retest the long-term support at $2,815 this week.


