Key Findings: BTC Technical Analysis
- Bitcoin price surge slows as Grayscale accuses SEC of unjust discrimination against its shareholders.
- The price might suffer a 5% fall to $60,000, providing sidelined investors with more buying opportunities.
- A daily candle closing below $60K can start and prolong the decline of Bitcoin to $50,000.
Bitcoin Technical Analysis – BTC Daily Price Chart

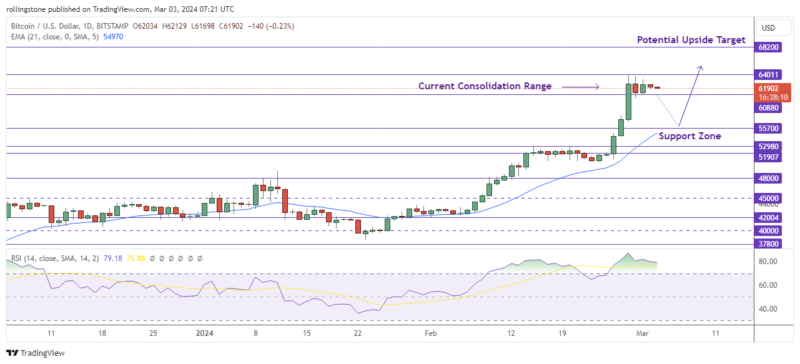
A multi-year supply zone has rejected the Bitcoin (BTC) price, but this correction is healthy, allowing stalled investors and late buyers to join the bullish rally. Meanwhile, Grayscale is embroiled in a new dispute with the US financial authority as it seeks to reach a new segment of clients.
On Wednesday, the bitcoin price entered the supply zone of $62,900 to $68,200 but was denied. The price rejected the resistance at $64,011 while gradually losing momentum. A daily close above it would ensure the trend’s persistence.
With the supply zone acting as resistance, the continuous rejection might cause Bitcoin to retest the psychological threshold of $60,000, providing an opportunity for sidelined and late investors. This would represent a 5% drop below current levels.
Nonetheless, the thesis remains bullish, as the market favors the upside. This is demonstrated by the northern slant of the RSI, which indicates that momentum is still growing.
If the Bitcoin price rises over the $64,011 midline, it might keep up the bullish move until hitting the long-term resistance at $68,200.
See Related: Bitcoin, Ethereum Technical Analysis
Key Findings: ETH Technical Analysis
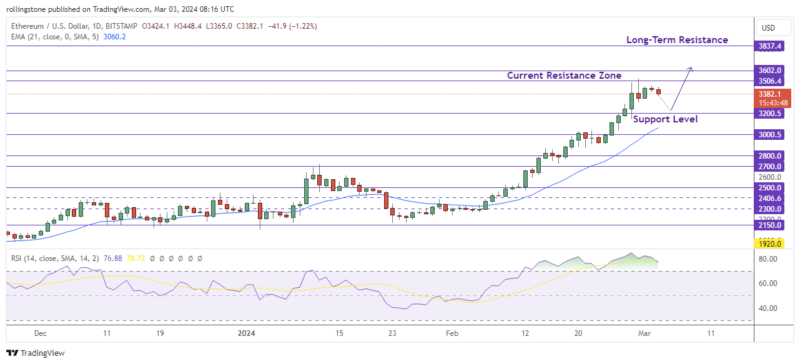
- Ethereum’s price firmly rejected the long-term resistance at $3,506 before slowing down the recent bullish move.
- If ETH closes over $3,602.43, it might spark a rally above the January 2021 high.
- A break and closing below the channel’s midrange at $2,684 would undermine the current bullish sentiment.
Ethereum Technical Analysis – ETH Daily Price Chart

Ethereum price has surpassed the 50% Fibonacci retracement level near $2,684, following a positive comeback above the psychological milestone of $2,000 in November 2023.
With momentum growing, ETH price could break the $3,602 barrier before extending to the local high of $3,837. A weekly candlestick closing over $3,602.43 would allow for more gains based on the current bullish move.
Conversely, if the $3,602 remains a weekly resistance level, the ETHUSD may retest the mid-level of the current market range at $2,684. A break of this support will invalidate the overall bullish momentum.


