Key Findings: BTC Technical Analysis
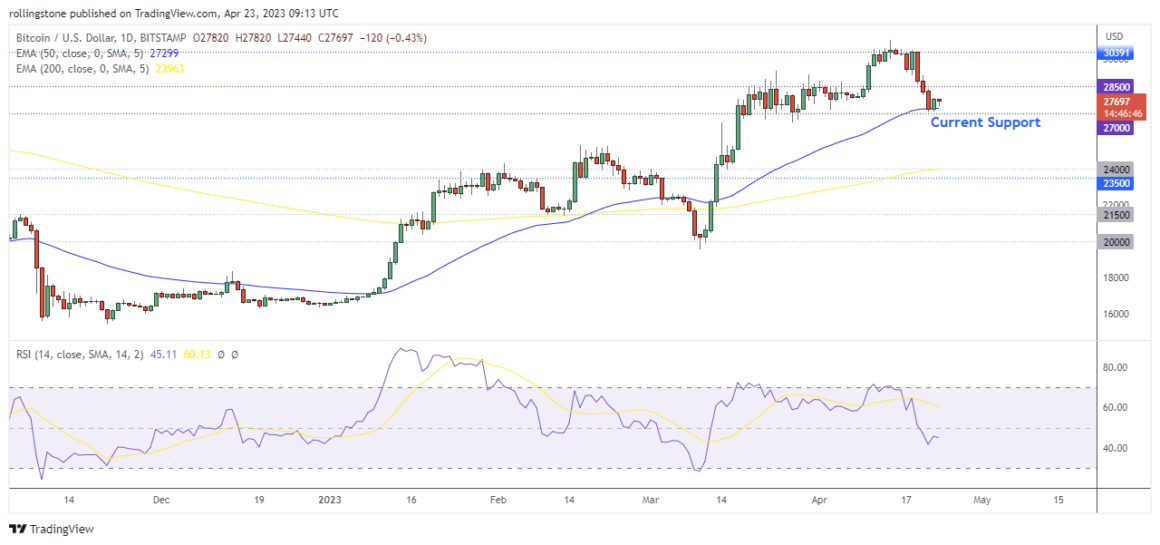
- Bitcoin retests the 50 EMA support following the current bearish momentum.
- The price may retest the key support at $23,500 if it fails to sustain above $27,000.
- The 50 and 100 EMA crossover still suggests an overall bullish trend.
Bitcoin Technical Analysis

Bitcoin hit the 50 EMA support on Friday at $27,140 following the recent bearish momentum initiated after the price got rejected from $30,000.
The RSI dropped below the 14 SMA and currently moving below 50, indicating the continuation of the short-term downtrend.
If BTC breaks the current support at $27,000, we may see the price declining more to retest the key support near $23,500.
For a bullish outlook, Bitcoin must exceed the $28,500 level to initiate the effort to return above $30,000.
Key Findings: ETH Technical Analysis
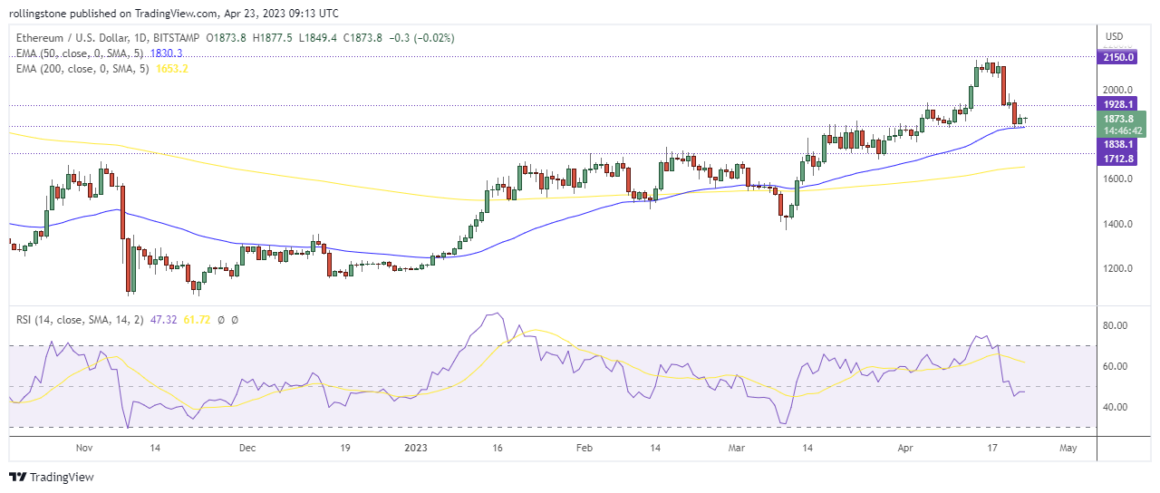
- Ethereum may rejoin the recent bullish trend if the price can hold above $1,800.
- The price may retest $2,150 if it can exceed the upcoming resistance at $1928.
- RSI below 50 indicates the existence of bearish momentum.
Ethereum Technical Analysis

Ethereum made a rapid move below $1,900 after the price failed to break the resistance at $2,150. A break below the current support at $1,839 may drive the price near the critical support at $1,712.
The price is still holding above the 50 EMA dynamic support, indicating ETH switched to an uptrend movement. A bullish reversal above $1,839 may lead Ethereum price above $2,000 again.


