Early on April 15, major cryptocurrencies experienced mixed trading as the market cap of all cryptocurrencies grew by 0.10% to $1.27 trillion from the previous day.
Over the past 24 hours, the overall volume of the crypto market decreased 42.17 percent, reaching $34.25 billion. DeFi’s 24-hour volume was $3.69 billion, or 10.78% of the total volume of the cryptocurrency market.
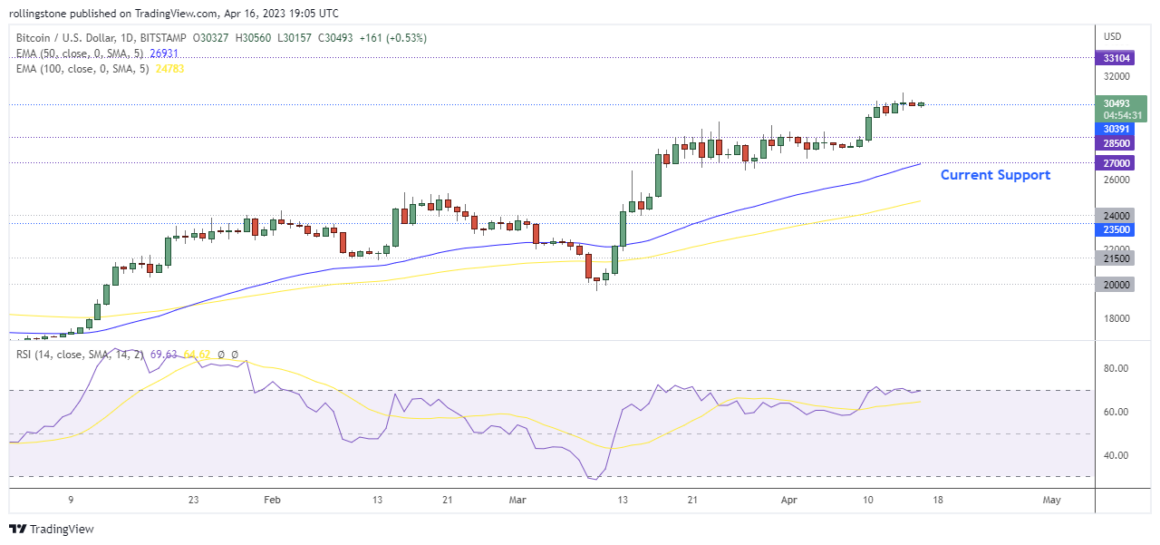
The price of bitcoin BTC tickers down $30,330 and increased by over 10% from April 9th to 14th, which was the most significant daily close in more than ten months.
Key Findings: BTC Technical Analysis
- BTC holds above $30,000 following the recent bullish move.
- The 50 EMA exceeding the 100 EMA indicates a strong uptrend.
- RSI at 69.41 signals a slightly overbought market.
- The price may pull back near the current support zone at $2850 before rejoining the bullish rally.
Bitcoin Technical Analysis

BTC/USD is firmly bullish and eyeing $33,100 as the next upside target. Source: The Distributed.
On Saturday, Bitcoin (BTC) fell back below the $31,000 mark as cryptocurrency markets stabilized ahead of the weekend.
BTC/USD hit a high of $31,005 on Friday before rebounding near the $30,000 level.
Bitcoin reached its highest point since June 7 at yesterday’s top, which appears to have encouraged bulls to lock in gains.
Furthermore, the bullish crossover between the 50 and 100 EMA still remains valid, indicating an overall uptrend. If BTC continues with the current upside rally, the price may retest the upcoming resistance at $33,100.
However, the Relative Strength Index (RSI) hitting near the 70 levels indicates an overbought market. In case the price decides to a correction, we’ll wait to see how the price reacts near the $30,000 to $28.500 zones to anticipate the next possible destination of Bitcoin price.
Key Findings: ETH Technical Analysis
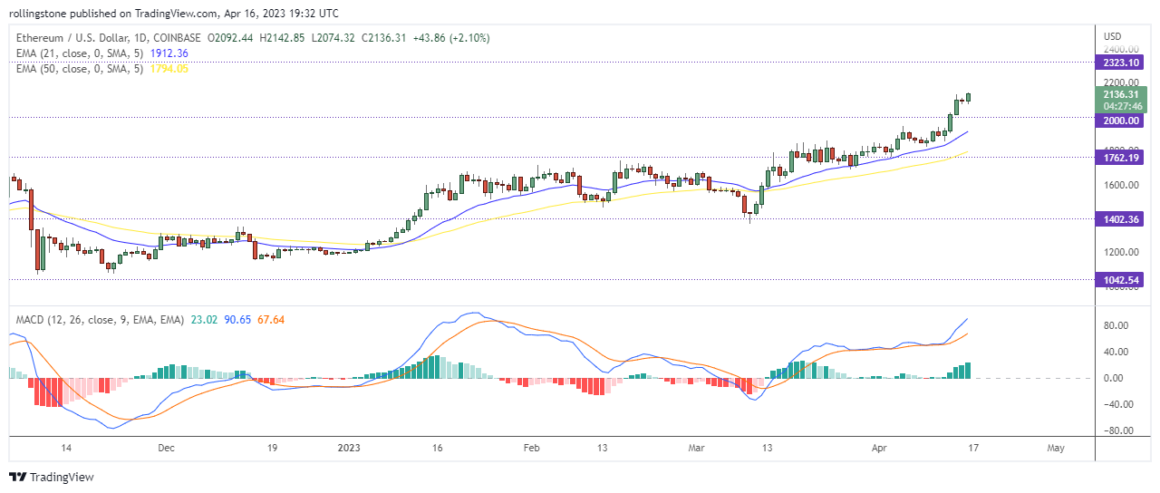
- Ethereum remains firmly bullish above $2,000.
- The price may hit the next resistance at $2300 following the current uptrend.
- MACD value remains positive and exceeds 20, indicating strong bullish momentum.
- For a bearish outlook, $1760 remains a strong support zone for ETH.
Ethereum Technical Analysis

ETH/USD can retest the upcoming resistance at $2,300 as the bullish rally accelerates. Source: The Distributed.
Despite being lower than Friday’s high, Ethereum (ETH) has remained above $2,100 in Saturday’s session.
ETH/USD plummeted to an intraday low of $2,049 earlier in the day but has since rebounded to trade at $2,103. This is slightly lower than yesterday’s top of $2,120 when ETH traded at its highest level since late May.
The 21 EMA is moving above the 50 EMA, suggesting a bullish crossover. Besides, the MACD holds above 20 and keeps surging, indicating strong bullish momentum.
The next resistance for Ethereum remains at $2,300. If ETH breaks below $2,000, the price may encounter strong support near $1,760.


