Ethereum: Key Findings
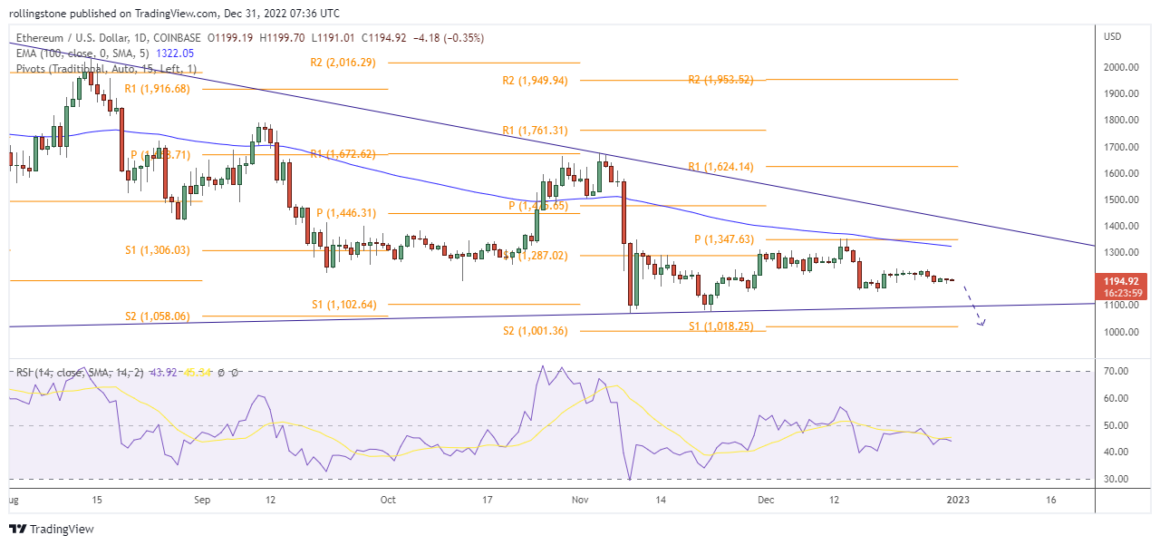
- Our Ethereum technical analysis deduced the price is under an overall downtrend and moving below a long-term trendline resistance.
- The price fails to sustain above the 100 EMA and keeps consolidating below $1300.
- The recent rejection at the pivot resistance ($1347) suggests ETH still intends for a further downside movement.
- RSI holds under 50 and recently moved below the 14 SMA, indicating strong bearish momentum.
- Upcoming support: $1100, $1000.

See Related: Hong Kong Welcomes First Bitcoin, Ethereum ETFs By CSOP Asset Management
Ethereum (ETH) Technical Analysis
Ethereum rejected the current trendline resistance on November 5th, indicating the price has no intention to reverse for a bullish trend anytime soon. Instead, the price dropped below the 100 EMA on November 8th and continues to consolidate below the current pivot resistance at $1350.
The price has even dropped below the $1,200 mark and currently testing minor support around $1,180. There was a minimal increase above $1,192 since the price rose above the 23.6% Fibo retracement zone of the decline, from the $1,232 (swing high) to the $1,180 low.
Furthermore, the Relative Strength Index has already held below 50 and moving under the 14 SMA level, suggesting a bearish momentum.
Ethereum is expected to encounter trendline support near $1,100 if it decides on another downside rally under the current bearish trend. In case the price breaks, the trendline support, the $1,000 price level will be considered as an ultimate support zone.


