Litecoin: Key Findings
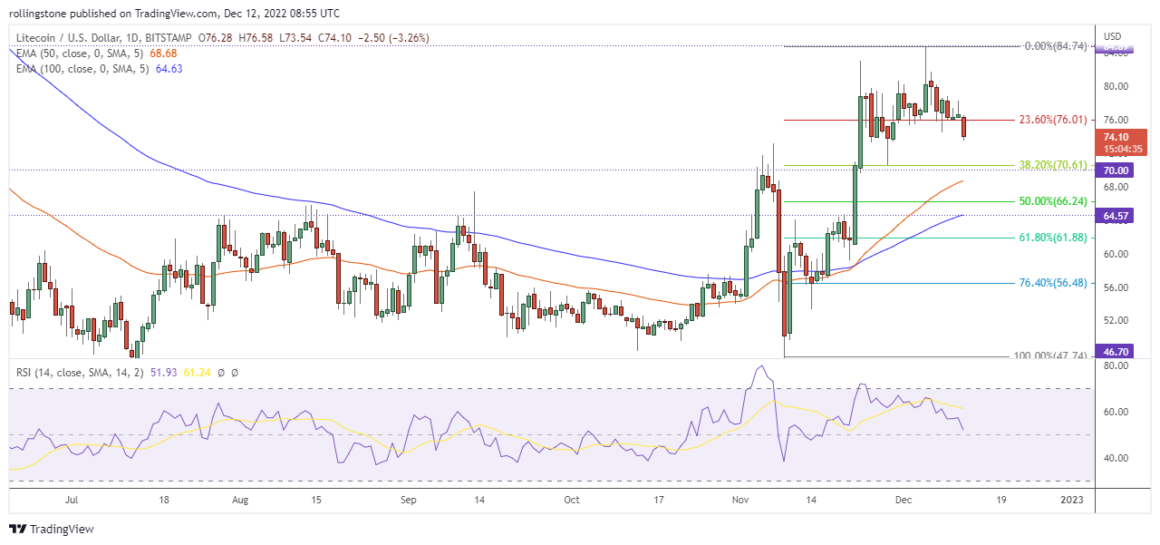
- Litecoin started consolidating around $75 since hitting the long-term resistance at $84.89 on December 5th.
- The 50 and 100 EMA plot a bullish crossover, suggesting the current uptrend is still valid.
- Relative Strength Index (RSI) drops below the 14 SMA but still holds above 50.
- LTC may pull back near the key support at $70 before rebounding for a bullish move.
- Litecoin will technically enter a bearish trend if the price breaks the critical support at $64.57.

Litecoin (LTC) Technical Analysis
Despite the recent bearish momentum, Litecoin is still under an overall bullish trend and may rejoin the upside rally from the strong support zone near $70.
The price started a sluggish bearish movement after being rejected from the long-term resistance at $84.89. According to Fibonacci, LTC is currently trading below 23.6% ($76.01) and approaching the next potential retracement zone at 38.2% ($70.61).
The 50 EMA is still maintaining above the 100 EMA, indicating Litecoin is still holding bullish momentum. Besides, the 50 EMA may work as a dynamic support near $70 if the price decides for a further correction.
Furthermore, RSI has dropped below the 14 SMA after rebounding from the overbought zone. However, the index is yet to move below 50 to signal a bearish momentum.
If the price rebounds from the critical support zone between $64.57 – $70, we may see LTC rejoin the recent bullish trend and move for the next potential upside target near $93.43.
See Related: Binance Coin (BNB) Technical Analysis As Recession Worries Continue To Rise


