Quant: Key Findings
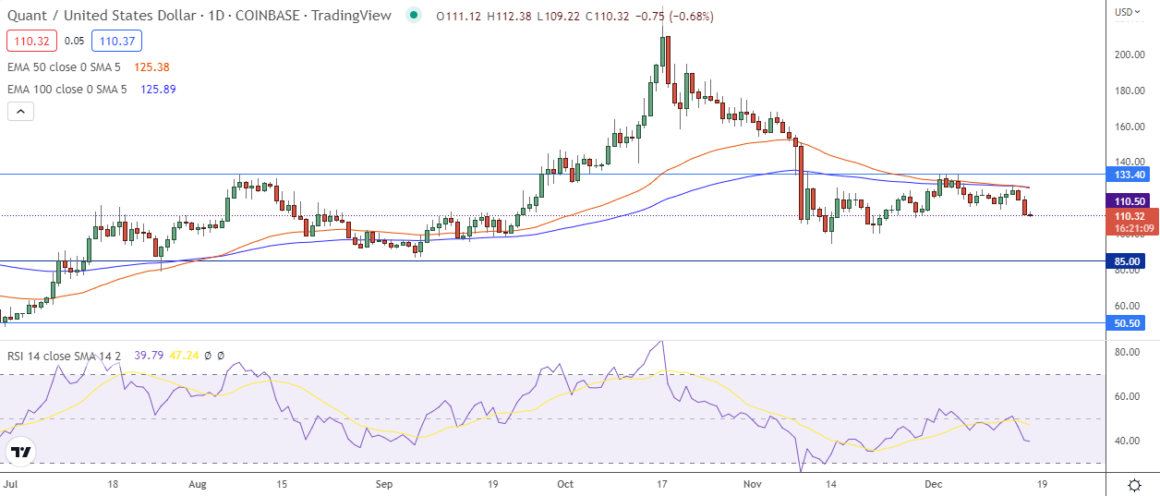
- QNT rejected the resistance at $133.40 before rejoining the recent downtrend.
- The daily chart prints a double-top pattern right below the current resistance.
- The price is holding below both 50 and 100 EMA, indicating a downtrend.
- Quant is now testing support at $110.50 following the overall bearish momentum.
- The technical analysis on Quant found the key support near $85 is a potential downside target for QNT.

Quant (QNT) Technical Analysis
The Quant price got rejected at the current resistance near $133.40 multiple times and showed no sign of returning to the level anytime soon. The price moved below 50 and 100 EMA, suggesting an upcoming downtrend.
However, the EMAs are yet to plot a bearish crossover. Since the price is testing the current support at $110.50, a bearish breakout at this level may enforce the 50 EMA to move below the 100 EMA, confirming a fresh bearish trend.
QNT daily chart shows the price has formed a double top pattern right below the critical resistance ($133.40) and rejected the dynamic resistance of exponential moving averages multiple times.
The Relative Strength Index (RSI) value drops below 50 and the 14 SMA, and currently roaming around 40, signaling a strong bearish momentum.
The recent development of overall bearish sentiment suggests Quant may break the current support at $110.50 and return to a further downside target near $85.
See Related: Bitcoin Exchange Reserves Hit New Lows


