Solana Quick Analysis
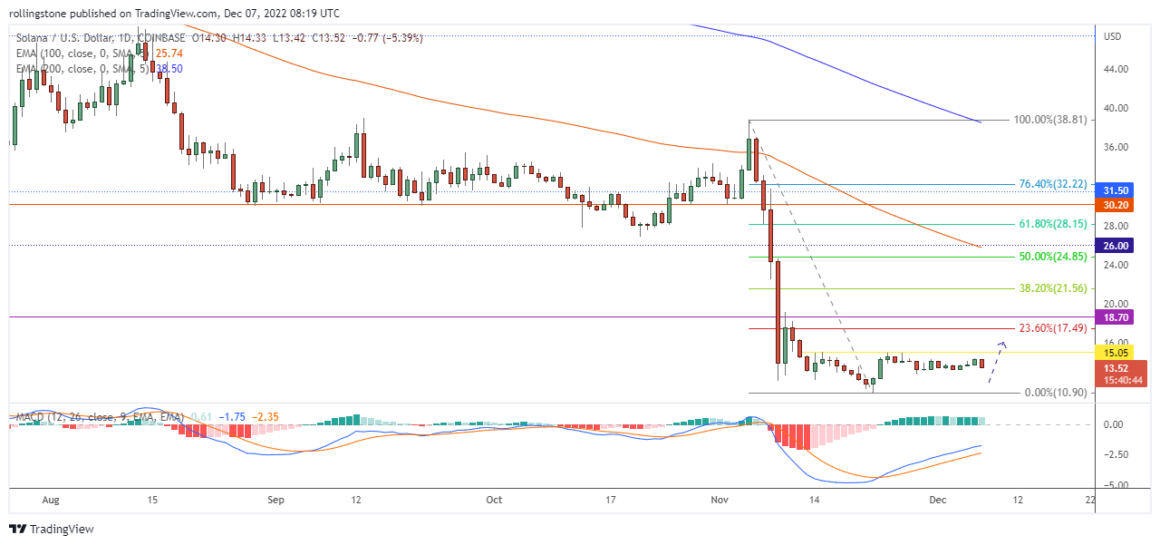
- Solana is holding above the recent market bottom ($10.94) and testing the short-term resistance near $15.05.
- MACD indicates an upside momentum that could trigger a bullish breakout of the current consolidation range.
- The upcoming resistance at $18.70 can be crucial in deciding the future trend direction.
- The 100 EMA is still moving below the 200 EMA, suggesting Solana is still under a long-term downtrend.

Solana (SOL) Technical Analysis
Despite lacking a violent breakthrough, SOL could withstand the tumultuous US trading session. Bulls remained active and were observed ticking near the current consolidation high at $15.05. A bullish breakout at this level may lead the price hit the next resistance at $18.70.
Solana has rejoined the long-term downtrend following a false break at the 100 EMA on November 6th, which resulted in the price hitting a new bottom at $10.94 on November 22nd.
However, the price recovered approximately 24.93% since hitting the fresh market low and currently trading below short-term resistance at $15.05.
Moving Average Convergence and Divergence shows that the MACD line has already exceeded the signal MA. Additionally, the MACD bars closing above the zero level indicate a bullish momentum.
A rise in mood was the cause of Monday’s rip in the equity markets. Another peak would suggest a nosedive toward $10, which would cause massive disappointment in international markets as US inflation data is due next week.


