Ripple Technical Analysis: Key Findings
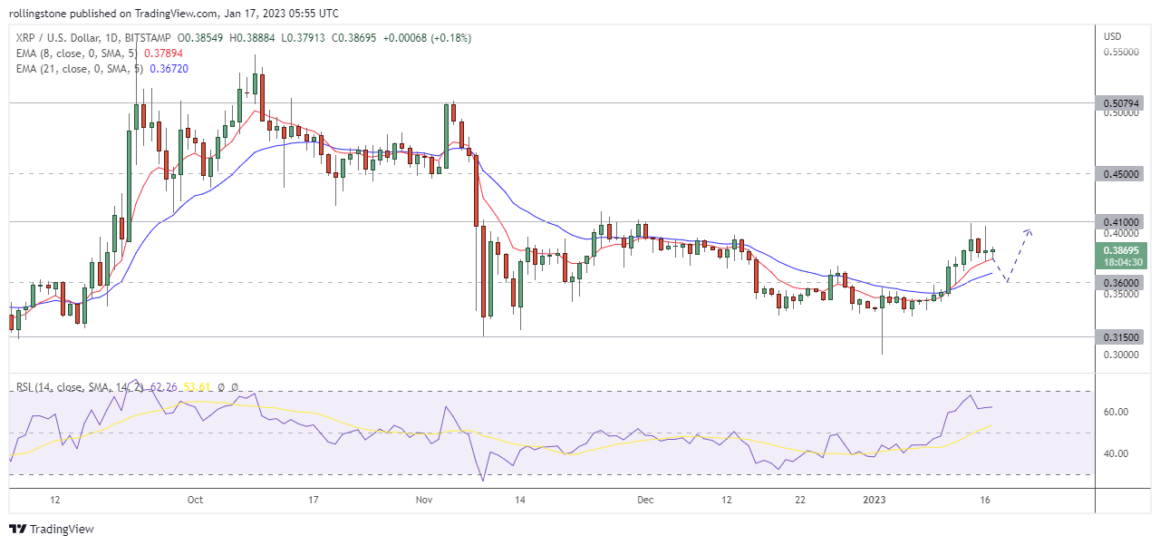
- Ripple initiated a bullish move after the price rejected the long-term support at $0.3150.
- XRPUSD has already retested the immediate resistance at $0.4100 and currently trading around $0.3869.
- The 8 & 21 EMA signals a bullish crossover.
- RSI above 50, indicating bullish momentum.
- XRP must rebound from the immediate support at $0.3600 and break above $0.4100 to continue with the current uptrend and approach the potential upside target near $0.4500.

Ripple Technical Analysis
As the planets appear to be aligned for a bullish run to begin, the price of XRP may set out on a new voyage north. The 2022 lows were liquidated early in the month, on January 1, and since then, the price of XRP has rapidly risen.
The token price is up 25% as of the time of writing, and there are hints that more significant gains may be realized very soon.
See Related: Ripple Intends To Bring Ethereum Smart Contracts To Its Blockchain
Right now, the XRP price is bidding at $0.3870. The XRP price increased by 7% on January 11 and surged beyond the 8-day EMA, marking the most significant rise of the year so far. Given that the indicator consistently served as resistance earlier this month, the obstacle was a substantial confirmation of the uptrend that has been going on.
The 8 EMA exceeded the 21 EMA to plot a bullish crossover that signals a possible extension of the current bullish move. Besides, the RSI is above the 14 SMA and 50-level, indicating strong bullish momentum.
Technically, Ripple may pull back for a while, but the price must survive above the immediate support near $0.3600 and exceed the upcoming resistance at $0.4100 to continue with the current uptrend. The long-term upside target remains at $0.4500.
According to Ripples technical analysis, if XRP breaks below $0.3600, we may see the price retests the critical support zone near $0.3150.


