
Key Findings: BTC Technical Analysis
- BlackRock filing for Spot Bitcoin ETF plotted a bullish spark in the Crypto Market Over the Last Seven Days.
- BTC made a solid bullish move exceeding the psychological resistance at $30,000.
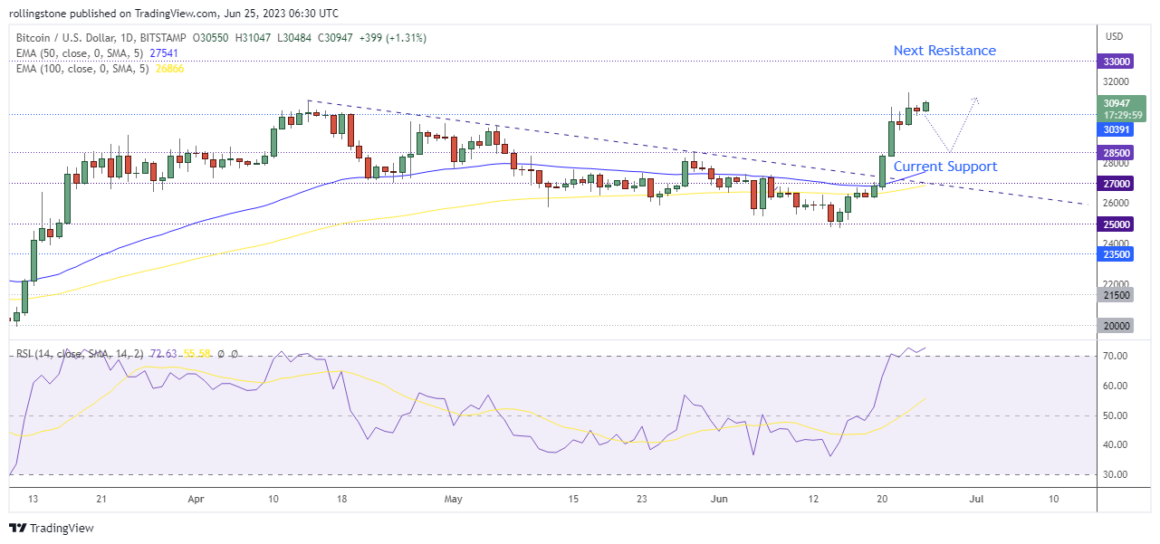
- The next upside target is around $33,000, but the price may surpass the current support at $28,500 before resuming the bullish surge.
Bitcoin Technical Analysis
(Source: The Distributed)
American multi-national asset management and investment company filed get its spot in BTC ETF has brought back an overall bullish momentum around cryptocurrency markets. Following the event, the Bitcoin price secured a gain above 15% over the past week.
Bitcoin bulls once again dominated market sentiment, driving the price beyond $31,000 late Friday night. Following an early low of $29,927, BTC/USD rose to an intraday high of $31,389.54 as the day progressed.
However, the relative strength index (RSI) at 72.35 suggests BTC has reached the overbought condition and may decide to pull back before plotting the next bullish move. The current support at $28,500 can be an ideal zone for buyers planning to add more long positions in the wake of the current bullish sentiment.
BTC is now strongly persuading the ongoing bullish trend. If the price holds above the $28K – $30K zone, we may see Bitcoin hitting the next resistance at $33,000 within weeks.
Key Findings: ETH Technical Analysis
- Ethereum is testing the long-term resistance at $1,928 following the bullish momentum.
- The price made a robust bullish move following the rejection around the $1,620 level.
- ETH may test the upcoming resistance around $2,000 if the price exceeds the $1.9K zone.
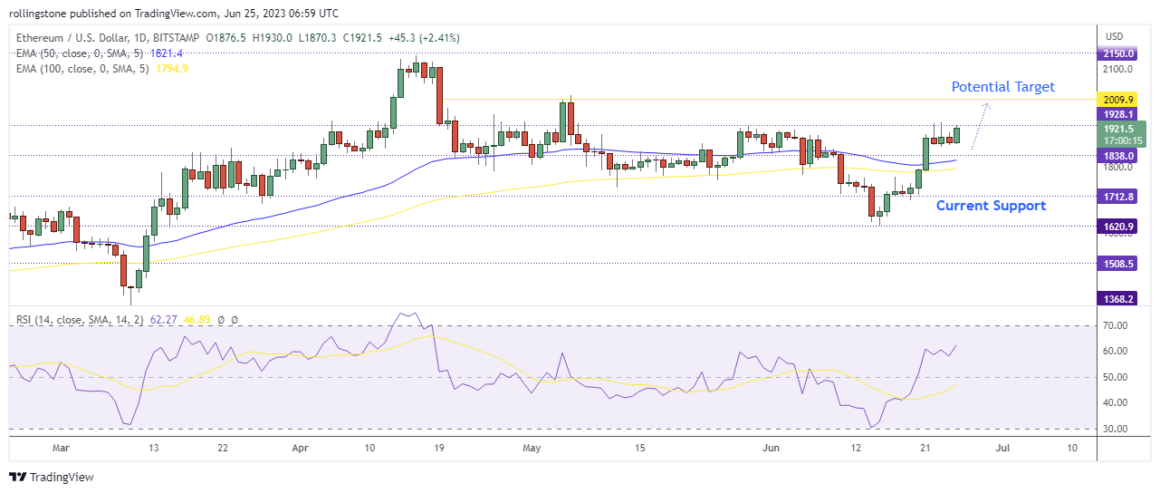
Ethereum rejected a move below the support at $1,620 on June 15 and rebounded for a strong bullish move. This trend-reversal event has made the price break two consecutive resistance lay at $1,712 and $1,838 over the last seven days.
The RSI is still below 70, indicating the price hasn’t yet reached the overbought zone. So, there is room for ETH to make further gains following the current bullish momentum.
We’ll closely examine how the price reacts around the current resistance at $1,928. If this level is broken, our next upside target for Ethereum will be $2,000.