
Key Findings: BTC Technical Analysis
- Bitcoin ETFs saw steady withdrawals totaling more than $730 million throughout the week.
- Despite persistent profit-taking by Bitcoin holders, the amount of BTC available on exchanges has decreased by 27% over the last six months.
- BTC/USD might initiate a long-term downtrend if the price breaks the current support zone of $60,880 – $64,011.
Bitcoin Technical Analysis – BTC/USD Daily Chart
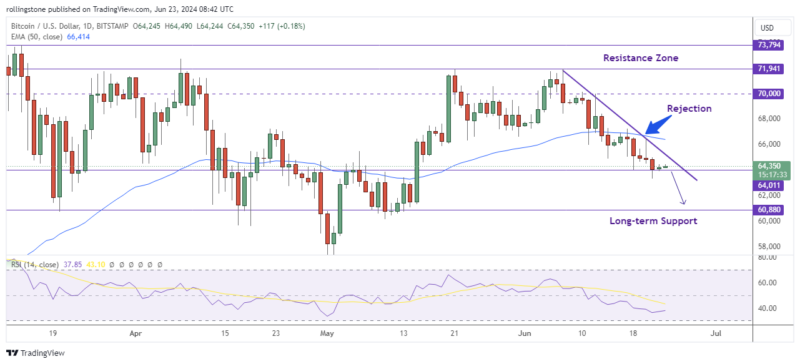
Bitcoin hit a monthly low of $63,379 as withdrawals from investment products and exchange-traded funds (ETFs) increased. Bitcoin ETFs saw withdrawals of more than $730 million in a single week.
On Binance, the price of bitcoin fell by about 3% over the previous seven days. A market-wide correction rocked altcoins when BTC dropped below $65,000.
According to the daily chart below, the price of bitcoin was rejected on Monday from the weekly resistance near $70K and is presently trading inside a bearish trendline that is derived from several swing highs between early and mid-June.
If the price breaks the current support at $64,011, we might see BTC retesting the psychological support located at $60,880.
In the event that the $62,451 support level is maintained and Bitcoin breaks above the declining channel, it may rise 7.5% to $67,147, the previous resistance level.
See Related: Bitcoin And Ethereum Technical Analysis: BTC Plots Double-Top Pattern Below $71K
Key Findings: ETH Technical Analysis
- Ethereum rejects the immediate resistance at $3,602 amid a growing bearish momentum.
- The current ETH/USD price consolidation might end up with a bearish breakout below $3.5K.
- ETH is testing the 50-EMA support at $3,506 and a break below this level can force the price to retest the $3,024 level.
Ethereum Technical Analysis – ETH/USD Daily Chart
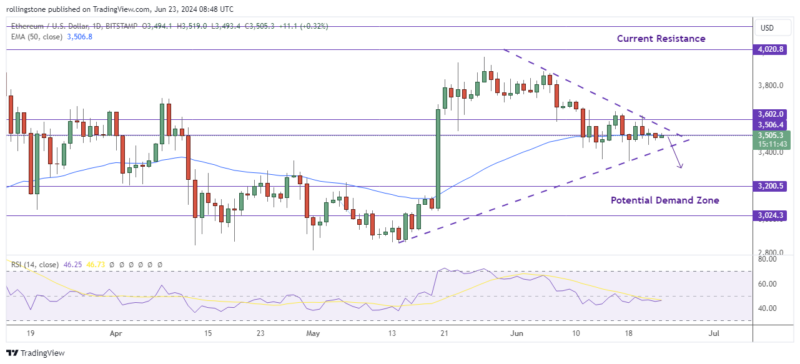
The price of ETH has returned to $3,500 as the daily timeframe demonstrates, having once again been rejected by the resistance at $4,000. The price is currently restrained at $3,506, keeping it from falling any lower toward $3,000.
However, should the $3,506 level be breached downward, the market will probably fall swiftly in the direction of the support zone near $3,000 as well as the 200-MA in close proximity.
Given these factors, the $3,500 level would become crucial, and how the price responds to it would probably determine the direction of the market in the upcoming months.