
BNB Technical Analysis: Key Findings
- BNBUSD pulled back from the current support at $220 despite the recent bearish rally.
- The bullish movement got restricted below the resistance at $253.
- The bearish crossover between 8 and 21 EMA suggests an overall downtrend.
- RSI value holds below 40, indicating bearish momentum.
- The price must exceed the resistance at $253 to revive the bullish momentum.
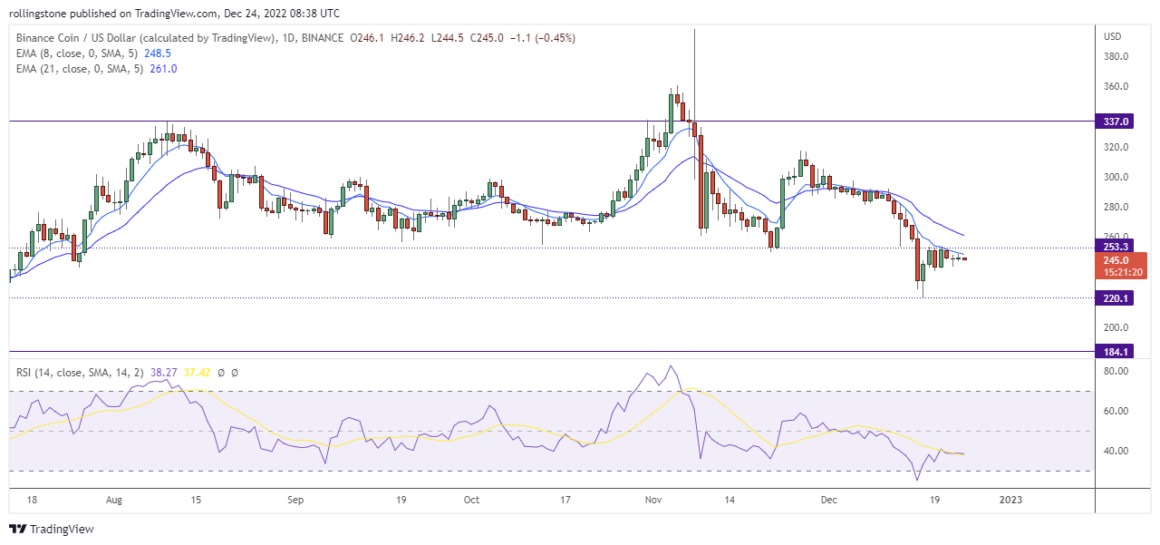
Binance Coin has been under an overall bearish sentiment since the price dropped below $250. However, the price rejected the support at $220 and gained 11.26% since December 17. The bullish momentum started weakening after sellers restricted the price below the current resistance at $253.
The price is currently testing the dynamic resistance at 8 EMA. Besides, the 8 and 21 EMA plots a bearish crossover that signals an overall downtrend.
Furthermore, the Relative Strength Index (RSI) value fails to exceed 50 and currently lying below 40, suggesting a revival of the bearish momentum.
If the price decides to rejoin the current bearish trend, BNB price may drop to a further downside target near the long-term support at $184. Contrarily, a bullish breakout of the current consolidation range may revive the recent bullish momentum and push the price above the $300 mark.
See Related: Binance Coin (BNB) Technical Analysis As Recession Worries Continue To Rise

Affiliate link — we may earn a commission.