
Key Findings: BTC Technical Analysis
- Bitcoin counters massive sell pressure above the $27,000 zone.
- The price also failed to exceed 50 and 100 EMA, indicating a further bearish move.
- The support near $25K remains a primary downside target for BTC.
Bitcoin Technical Analysis
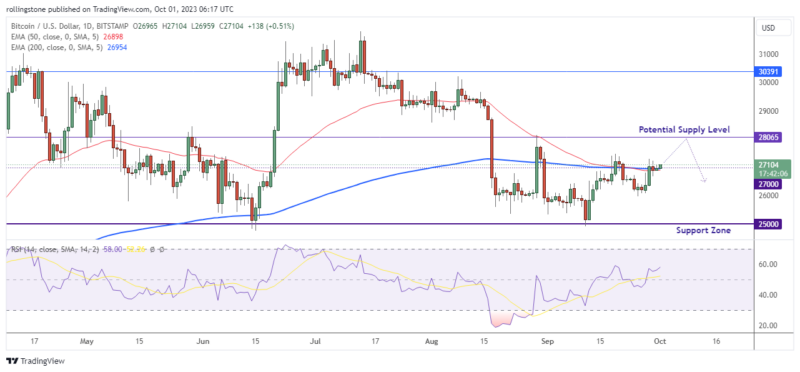
Bitcoin is developing slowly in a declining trend channel over the medium run. This shows growing investor skepticism and further depreciation for Bitcoin.
The currency has formed a lower high near $27,458, breaking the immediate support at $27,000. A decisive break through one of these levels signifies the currency’s new direction. BTC/USD trades between support points at $25000 and resistance at $27,000.
Since Bitcoin rejected both 50 and 100 EMA resistance and broke below the $27K zone, we expect the price to retest the $25K level before meeting any concrete demands from the buyers.
Key Findings: ETH Technical Analysis
- Ethereum’s price fails to sustain above the current resistance at $1,620.
- The 50 EMA gradually falls below 100 EMA, suggesting a solid bearish trend.
- The price may not counter strong demands until ETH tests support near $1,508.
Ethereum Technical Analysis
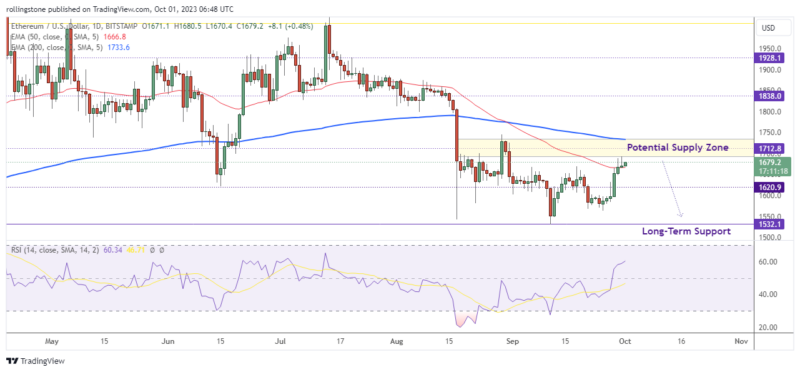
Ethereum’s long-term struggle to remain above $1,620 has failed as the price was unable to reach the 50 EMA resistance near $1,676 and declined below the $1.6K region. Technically, the price rejecting to exceed the $1,620 level will suggest mode downside movements at this point.
If the ETH moves above $1,600, the price may still counter massive supplies waiting near the resistance at $1,712. So, there remains a possibility that ETH/USD can retest the $1.7K zone before rejoining the current downtrend. Alternatively, failing to exceed the $1.6K level will print a bearish trend continuation pattern on the daily chart. In such a case, traders may look to sell on pullbacks near $1,620 and may set the $1,508 level as an initial trade-exit point.

Affiliate link — we may earn a commission.