
Key Findings: BTC Technical Analysis
- Over the last two weeks, the price of Bitcoin has fluctuated between $40,423 and $47,209, ranging within the weekly supply/demand zones.
- The Relative Strength Index (RSI) is at 56.17, indicating a bullish momentum.
- The current upside target at $48,000 will be invalidated if BTC breaks below the $37,800 level.
Bitcoin Technical Analysis – BTC Daily Price Chart
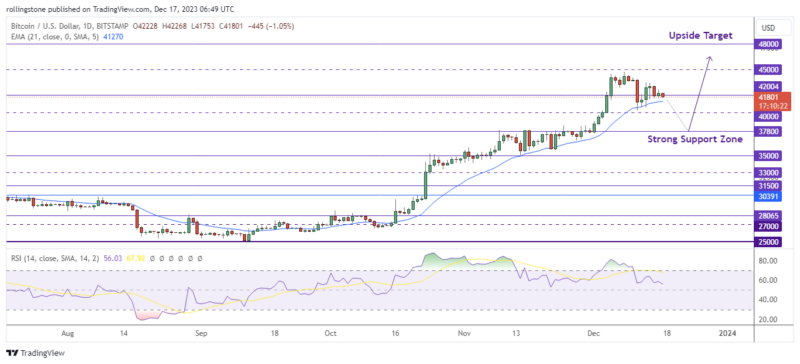
After the volatility on Thursday, the price of Bitcoin was noted to be circling $41,955 while writing this report. The market’s response to the coin was both bullish and bearish since the price rose to $43,500, fell to $41,500, and then returned to the current trading price.
Still, this had little effect on the short-term picture for price movement, which is moving towards $45,000 before the year ends. The Relative Strength Index (RSI) continues to show bullishness in the market.
According to the current consolidation range, BTC may use the $40,000 level as support to secure a rally above the $45,000 level and keep cruising towards $48,000. Alternatively, a break below the $40k zone may revive the bearish momentum and push the price to a further downside target near $37,800.
See Related: Bitcoin And Ethereum Technical Analysis
Key Findings: ETH Technical Analysis
- Ethereum plotted a false-break pattern at $2,300 and drove the price below $2,250.
- The price must find support above $2,150 to keep up the current bullish momentum.
- A break below the current support may lead the price to retest the $2,000 level.
Ethereum Technical Analysis – ETH Daily Price Chart
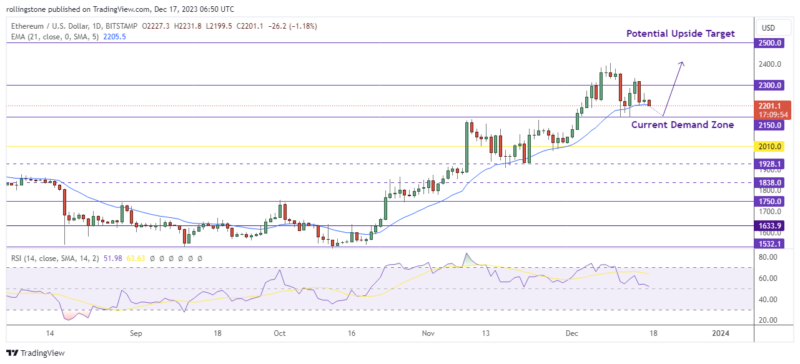
Ethereum has been quite bullish since October, as the daily chart shows. Another important trend signal, the 21-day exponential moving average, has been broken above by the market once more. The trend formally turned bullish once more when the price of ETH rose above the moving average.
However, ETH cannot rise any higher over the $2,400 region. Right now, ETHUSD is trading below $2,300, and the market will test the $2,150 or possibly the $2,000 support zone again. These levels might probably start a positive price rally, and in the upcoming weeks, Ethereum might strive for values above $2,500.

Affiliate link — we may earn a commission.