
Key Findings: BTC Technical Analysis
- Bitcoin encounters fresh supplies near the resistance at $64,011 after making a massive bullish move following the Feds’ rate-cut decision.
- If the price fails to break the $64K resistance, BTC might return below $60K, plotting a range-bound movement.
- The recent higher-low and lower-high formation on the daily chart indicates indecisions among market makers.
Bitcoin Technical Analysis – BTC Daily Chart
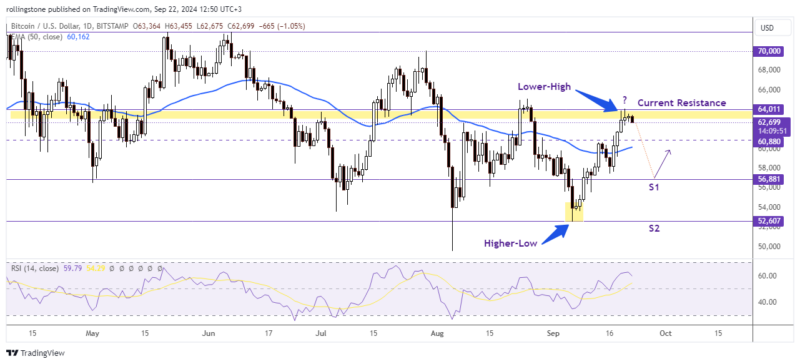
Last week, Bitcoin price was mainly driven by fundamental issues following the Fed’s rate-cut decisions. However, the market didn’t react as expected after this event and the impact was minimal at the end.
According to the daily chart, BTC/USD kept moving north carrying a strong bullish momentum since the price rejected a move below the support at $52,607 on September 6. During this period BTC broke a series of important levels including the horizontal resistance at $56,881 and the 50-EMA near $60,162.
However, the price stalled beneath the mid-term resistance at $64,011 after plotting multiple Doji inside bars below this level. If the price breaks the lows of these inside bars, we’ll consider it as a rejection of the $64K resistance, which might deliver a fresh bearish movement targeting a move below the $60K level.
The $56,881 and $52,607 levels represent key supports on the daily chart. Since Bitcoin is under an overall bullish momentum, the price might rebound for a bullish move from the $56K support level. Besides, the RSI at 59.73 suggests the price could bounce back for a bullish move targeting the $64K level following a possible pullback near the 50-EMA support.
See Related: Bitcoin And Ethereum Technical Analysis: BTC Price Bouncing Back From $64K Indicates Pure Consolidation
Key Findings: ETH Technical Analysis
- Ethereum was making a solid bullish move until the price hit the key resistance at 50-EMA.
- The Relative Strength Index (RSI) at 56.80 indicates a bullish momentum still persists.
- ETH could retest the critical support to be near $2,110 if the price fails to exceed $2.6K this week.
Ethereum Technical Analysis – ETH Daily Chart
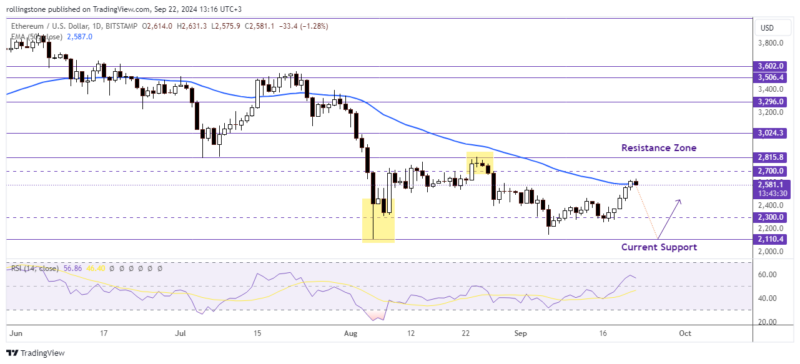
Ethereum was up 3% on Friday, as the Fed’s interest rate decision sparked its bullish rally like other altcoins last week. The price is still holding above $2,500 but could undergo a correction as it struggles to break the 50-EMA resistance at $2,586.
On the daily chart, ETH printed a series of solid bullish candles and the price was plotting higher lows above the critical support at $2,110, indicating the beginning of a fresh bullish trend. However, the price is stuck below 50-EMA and shows weakness while encountering supplies around this key level.
ETH/USD must break and hold above the $2.6K level to transform the current bullish momentum into a sustainable uptrend. Alternatively, if the price rebounds below the current resistance and pushes the RSI below 50, we might see Ethereum retest the $2,300 – $2,110 zone this week

Affiliate link — we may earn a commission.