
Key Findings: BTC Technical Analysis
- The upward trend in bitcoin price has encountered resistance near the daily high of the $35,000 region.
- With a projected target of $40,000, the price action of BTC has formed a pennant throughout the decline.
- The price may pull back near the $31,500 support line before rebounding to create a new high.
Bitcoin Technical Analysis
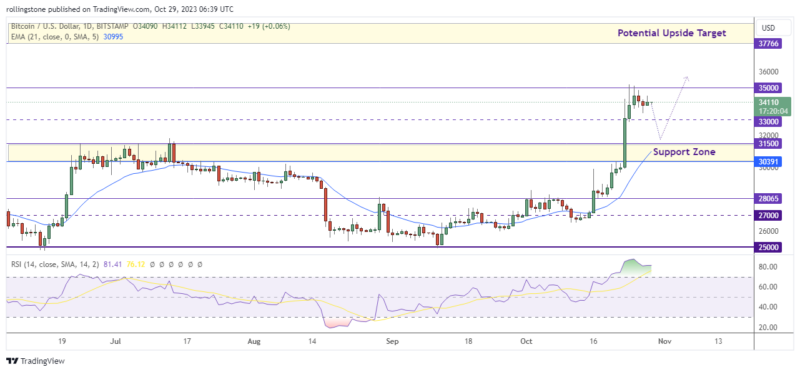
Over the previous week, the price of bitcoin has increased significantly, rising by almost 15%. We examine a few of the crucial technical levels.
When examining the daily chart, one can see that Bitcoin made a significant upward advance after breaking through the crucial resistance level at $27K.
The remarkable rise persisted, eventually breaking beyond the $32K barrier—a price that corresponds with the top of Bitcoin in 2023. Following this, traders pushed BTC price toward a key resistance area above $35K, indicated by the 0.5 through 0.618 Fibonacci levels, setting a new annual high.
According to the Relative Strength Index (RSI), the indicator value raised above 81, suggesting an overbought market. So, the price might decide for a pullback near the $31.5K support zone before launching the final mission to hit the $40K level.
Key Findings: ETH Technical Analysis
- Ethereum price has surged by 12% over the past two days, breaking over critical resistance around $1,750.
- The RSI rising above 50 suggests a potential spike in the bullish momentum.
- The price must break the resistance at $1,838 to move on to the potential upside target of $2,000.
Ethereum Technical Analysis
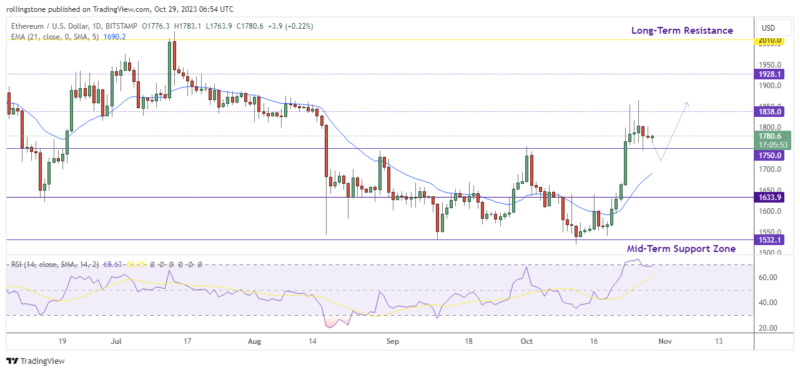
Ethereum’s (ETH) price surged 11.48% over the previous two days, breaking above the crucial barrier of $1,750. Bulls will need to hold above this $1,750 mark before investors can anticipate the upswing continuing to the next crucial key, $2,000.
However, if the ETH price fails to hold above the current resistance, this would indicate a pessimistic outlook. Investors should anticipate that in such a scenario, the bearish trend would gain control and cause a correction below $1,551.
Technically, Ethereum is under an overall uptrend but must rebound from $1,750 and exceed $1,838 to keep up the current bullish momentum.

Affiliate link — we may earn a commission.