
Key Findings: BTC Technical Analysis
- Bitcoin rose slightly on Friday as traders started to shift their focus to next week’s Fed meeting.
- The overall trend remains bearish as the price rejected the 100 EMA and dropped below the $26K zone.
- The psychological support at $25,000 may play a big role in deciding the upcoming trend of BTC.
Bitcoin Technical Analysis
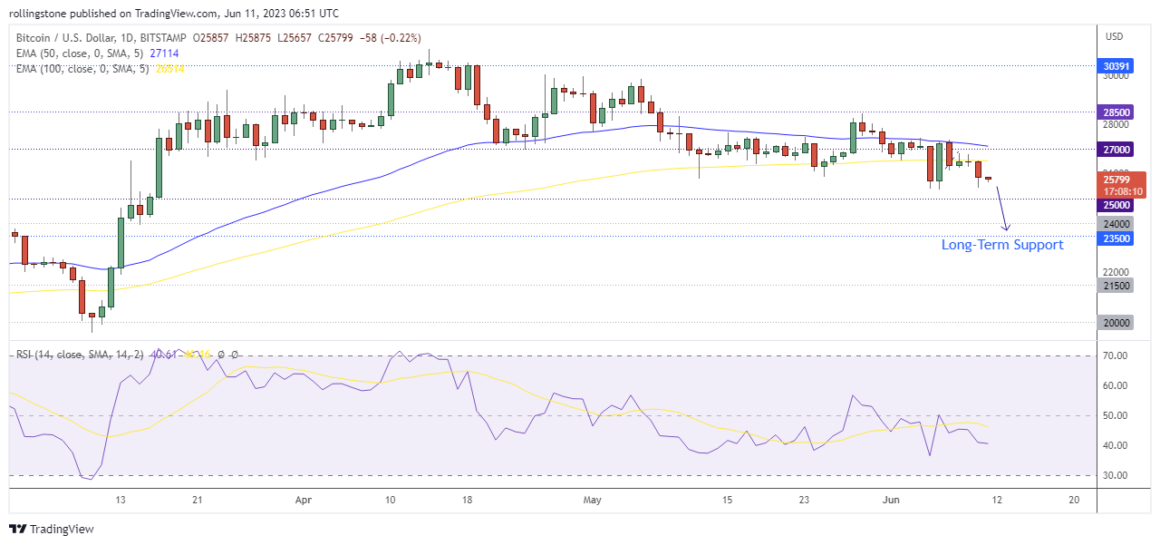
Bitcoin showed a little bullish momentum on Friday until the price was rejected by the resistance at 100 EMA. BTCUSD is trading at around $25.8K, just near the psychologically significant support at $25,000.
According to the RSI, the index value of 40.65 (below 50) confirms that BTC has already switched to bearish momentum.
If the $25K level is broken, there may be a further slide to the previous high of $24.5K or the 50-week moving average of $22.2K.
Key Findings: ETH Technical Analysis
- Bears were noticeable in Ethereum, which started the weekend below the $1,800 mark.
- The bearish breakout of the symmetrical triangle on the daily chart indicates a downtrend ahead.
- ETH will remain at risk of entering a long-term downtrend if the price breaks the support at $1,712.
Ethereum Technical Analysis
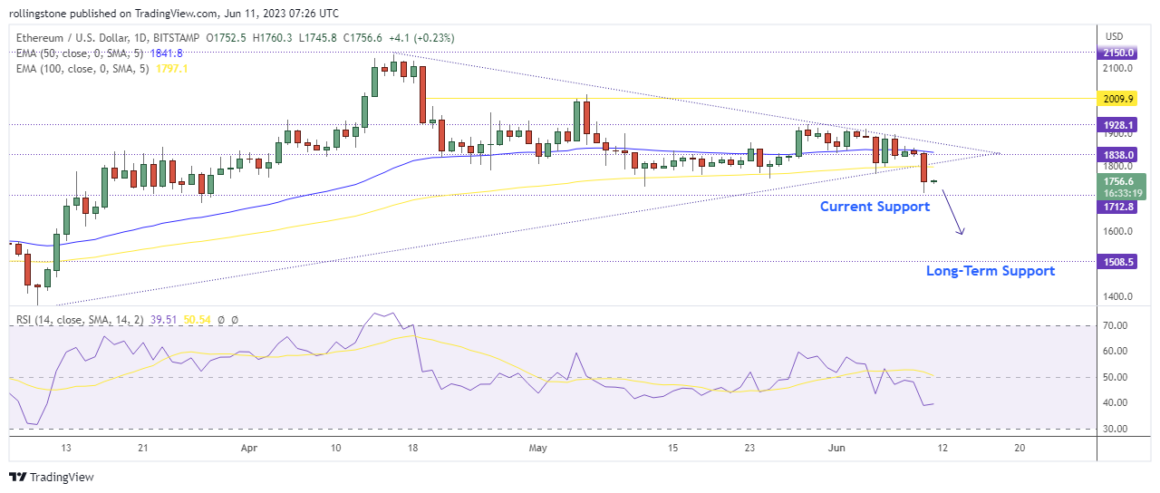
Ethereum plotted a solid bearish breakout of the symmetrical triangle on the daily chart, transforming the current price consolidation into an overall bearish mode.
This change in market momentum caused the RSI to lose steam and fall to its lowest point since March. The indicator is under 40.00, near oversold territory and could have a modest favourable impact on bulls.
The immediate support at $1,712 remains crucial as a potential bearish breakout of this level may push the price near $1.5K.

Affiliate link — we may earn a commission.