
Key Findings: BTC Technical Analysis
- Bitcoin’s price has crossed the $63K mark, indicating increased optimism for the cryptocurrency.
- With a net inflow of around $378.5 million, spot BTC ETFs saw their biggest inflow in the previous two months.
- A breach of the current resistance at $64K may lead the price to retest $70K next week.
Bitcoin Technical Analysis – BTC/USD Daily Chart

For the past few months, the price has been bouncing around inside a declining channel on the daily chart. A few days ago, there was a minor break in the channel to the downside.
But BTC rapidly recovered, climbing back into the channel and creating a phony bearish breakthrough. Given that the $60K level is now acting as support as well, the price will probably aim for the $70K resistance level in the near future.
As the BTC price is trading below $75,000, the majority of market players have been selling their holdings because they believe the bull market may be coming to an end or that a much deeper decline is likely.
If the price fails to break above the resistance at $64K, we’ll be watching how the price reacts near the support lines drawn at $60,880 and $56,881 to access the upcoming market trend and the potential destination of BTC price. A break of this support zone may force the price to move below the $50K region.
See Related: Bitcoin And Ethereum Technical Analysis: BTC Price Bouncing Back From $64K Indicates Pure Consolidation
Key Findings: ETH Technical Analysis
- Ethereum plotted a double bottom pattern in the daily chart while rejecting a move below the $3K level.
- The current bullish momentum keeps the price approaching the immediate resistance at $3.2K.
- ETH must exceed the 50 EMA ($3,217.5) to keep the overall uptrend sentiment alive this week.
Ethereum Technical Analysis – ETH/USD Daily Chart
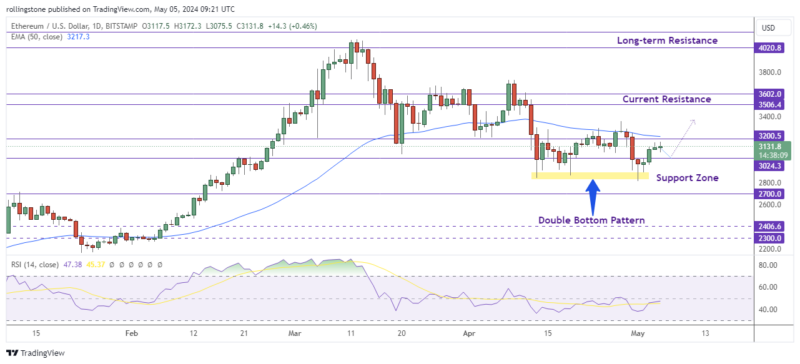
Ethereum’s recent price fluctuation suggests that a positive surge may be imminent. The resistance level of $3,200 from April 26 is likely to be faced by ETH now that it has broken through the $3,024 critical level on Friday.
If ETH can close a liquidity gap on April 30 and make a strong move above the $3.2K level, it might strengthen the current uptrend move targeting the $3.5K – $3.6K zone. Although there might not be a short-term bearish shift in ETH, this theory could be refuted by a significant macro event.
If long liquidations continue to lag shorts within this week, ETH may see significant gains over the course of the upcoming weekend. The course of this investigation will probably be significantly influenced by the movement of the price of bitcoin.

Affiliate link — we may earn a commission.