
Key Findings: BTC Technical Analysis
- BTC signals bullish momentum as the price holds above the 50-EMA support at $65,193.
- However, the price failed to sustain above the current resistance at $70K.
- Bitcoin’s price must exceed the critical resistance at $73,794 to establish a sustainable bullish trend.
Bitcoin Technical Analysis – BTC/USD Daily Chart
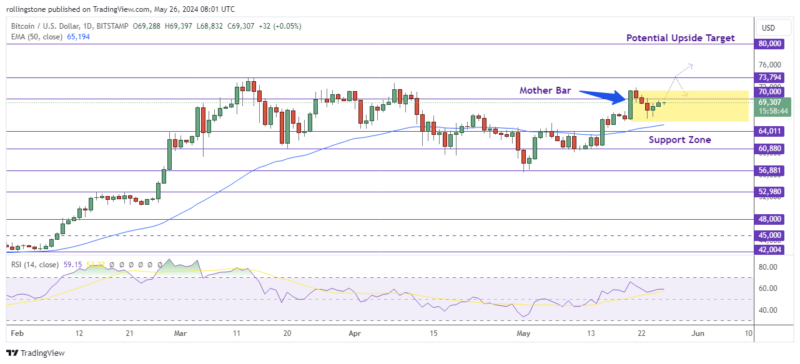
Bitcoin has been rising on the daily chart ever since it recovered from the support line at $60K. A recent test from the upper border of the huge descending channel resulted in its rejection. The $69K level is currently providing support for BTC/USD.
Bitcoin may rise once again above the channel’s upper border and possibly even higher above the $75K resistance level if the price sustains the $70K support.
The momentum appears to be turning again in favor of the buyers as the RSI also rises over the 50% mark. It would therefore just be a matter of time till the price moves to the $75K area and sets a new record high if the $70K support level holds.
See Related: Bitcoin And Ethereum Technical Analysis: BTC Likely To Reclaim $70K Following Major Bullish Breakouts
Key Findings: ETH Technical Analysis
- Ethereum struggles to break the minor resistance near $3,800 despite the recent bullish move.
- The price might retest the immediate supply zone ($4,020 – $4,161) if it can plot an inside bar breakout setup printed on the daily chart.
- Long traders can wait for a pullback near the mid-term support zone ($3,024 – $3,200) before considering fresh buy entries.
Ethereum Technical Analysis – ETH/USD Daily Chart
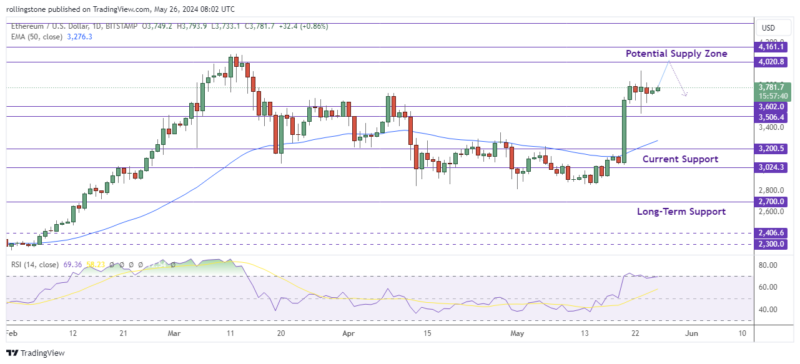
There are allegedly some encouraging indications for the leading altcoin, ETH. The current configuration of Ethereum (ETH) suggests that the currency is technically heading into a bull market, according to well-known market observers. According to the analytics, the well-known cryptocurrency token is gradually rising to new highs in value. It is now trading with little fluctuation at $3,757.
Furthermore, a lot of supply close to this crucial location has put more pressure on sales, which has raised volatility and led to a small consolidation. The market may surge toward the next major resistance level, which is located at about $4.5K if there is a clear break over it.
In spite of this, the way the market is now moving suggests that there may be a brief consolidation period before the next significant move. In this case, the buyers might wait for a pullback near the mid-term support at $3.6K before considering fresh entries.

Affiliate link — we may earn a commission.