
Key Findings: BTC Technical Analysis
- Bitcoin price has been consolidating between $43,817 and $41,500 since 27 January.
- The price might move on within the short-term bearish momentum to retest the $40K level.
- We may see BTC rejoining the overall bullish trend and cruise above $45K if the sellers fail to push the price below the $42K zone.
Bitcoin Technical Analysis – BTC Daily Price Chart
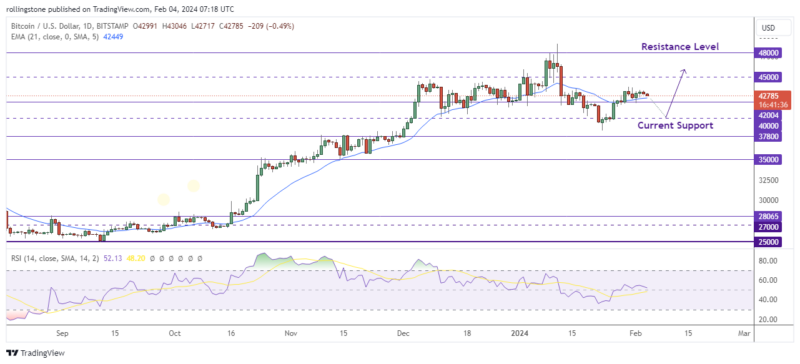
On Friday, Bitcoin (BTC) faced the $43,000 resistance level, showcasing a notable recovery from earlier weekly declines. This rebound signals a growing buying interest amid a turbulent week. Despite Bitcoin’s predominantly sideways movement over the past two months, certain on-chain metrics suggest a potential for further upward price momentum.
In the short term, Bitcoin’s price remains impartial with no discernible directional inclination, hovering around the $43,000 mark. Girimath contends that evident bullish signals from on-chain metrics could pave the way for Bitcoin to initiate a potential bull run.
The ongoing upward trajectory of Bitcoin’s price may persist following the January swing low at $38,505. Conversely, a correction to the $34,000 level is also a plausible scenario. The analysis highlights the prevailing anticipation among traders for a correction that clears out belated long positions, projecting Bitcoin to the $34,000 to $35,000 range. However, he asserts that the likelihood of such a correction is minimal.
Any descent of Bitcoin’s price into the daily imbalance zone spanning $41,396 to $40,278 becomes crucial when examining the daily timeframe. The reaction within the $40,000 region could serve as a determinant for BTC’s next move. A robust surge in buying activity holds the potential to propel Bitcoin to surpass $45,000, signaling a moderate buy signal for traders.
See Related: Bitcoin And Ethereum Price Prediction After Fed Hiked Interest Rates By 25 Basis Points
Key Findings: ETH Technical Analysis
- ETH’s monthly transaction count (36.02 million) has surged to its peak, reaching the highest level observed since July 2022.
- However, the price closing below the current resistance at $2,300 hints a short-term downside momentum is underway.
- The price might retest the strong support level at $2,150 and rebound for a bullish rally towards $2,800.
Ethereum Technical Analysis – ETH Daily Price Chart
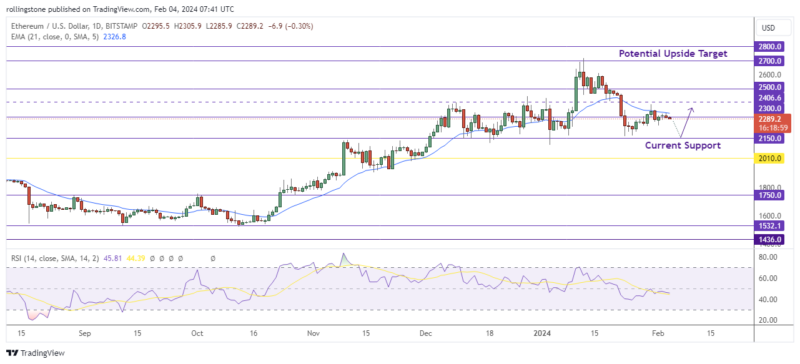
Similar to Bitcoin, the price of Ethereum (ETH) is moving following a little upward trendline. The RSI beneath 50 and the MACD and AO in the negative zone suggest a short-term bearish movement ahead.
Ethereum price might drop 5% to $2,150, or in a worst-case scenario, into the demand region between $2,059 and $2,118 since the odds are stacked against it.
On the other hand, a comeback by the bulls may cause the price of Bitcoin to reenter the fresh ascending channel by turning the $2,388 barrier into support. This might pave the way for a surge north in a very bullish scenario, with ETH regaining its previous high of $2,717.

Affiliate link — we may earn a commission.