
Key Findings: BTC Technical Analysis
- Bitcoin price is still stuck in a rut, sinking horizontally while bulls take a back seat.
- The price is still struggling to exceed the 50-EMA resistance, near $29,358.
- The immediate support at $28,500 remains the primary downside target for the BTC.
Bitcoin Technical Analysis
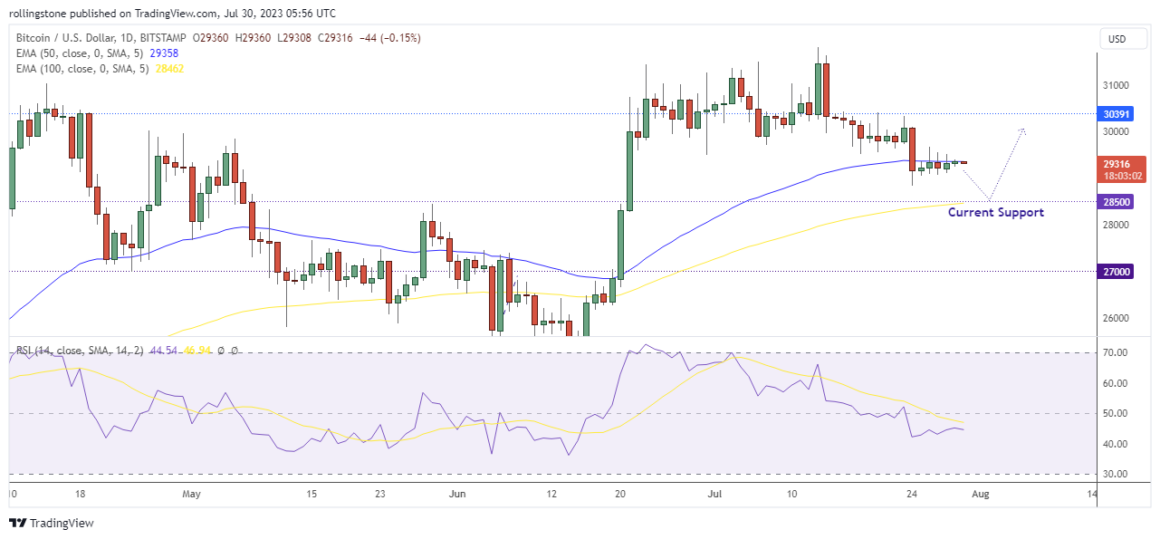
Early on Friday, Bitcoin (BTC) hovered above $29,000 while Japanese and American government bond yields increased as a result of the Bank of Japan (BOJ) maintaining low-interest rates while announcing a minor hawkish adjustment to its liquidity-boosting yield curve control (YCC) program.
The relative strength index (RSI) dropped to 44.08, indicating a bearish sentiment. If BTC sellers manage to keep the price below the 50-EMA resistance at $29,282, we may see the price hitting the immediate support near $28,500 in the upcoming week. Also, there is 100-EMA support lying close to the same support that may play a key deciding zone for the upcoming market bias of Bitcoin.
Key Findings: ETH Technical Analysis
- Ethereum price is steadily rising versus Bitcoin while settling in this massive collapsing wedge.
- The price looks steady above the 50-EMA level at $1,872 after it rejected the 100-EMA support.
- We may see ETH visiting the upcoming resistance at $1,928 if the current supports are not broken.
Ethereum Technical Analysis

Ethereum (ETH) is moving upwards relative to Bitcoin after consolidating gradually inside a falling wedge pattern on the daily chart. Lower highs and lower lows characterize this bullish technical pattern as the bulls make way for the bears. The appropriate amount of buyer momentum might see an ETH breakout to confirm the pattern when the price bounces off the lower threshold of the chart pattern. Since ETH rejected the 100-EMA and the horizontal support at $1,838, the price kept up the bullish momentum and managed to exceed the 50-EMA resistance at $1,871. However, the RSI value is yet to exceed 50 to confirm bullish momentum. From the technical point of view, Ethereum can retest the current resistance at $1,928 if the price denies movements below the $1.8K zone.

Affiliate link — we may earn a commission.