
Key Findings: BTC Technical Analysis
- Bitcoin is now trading at $43,800, but it might rise as high as $50,000 within the first quarter of the new year.
- The price is above the 21 EMA, and the RSI above 50 suggests a solid bullish momentum.
- BTC price might pull back inside the $42K – $40K range before approaching the potential upside target at $48K.
Bitcoin Technical Analysis – BTC Daily Price Chart
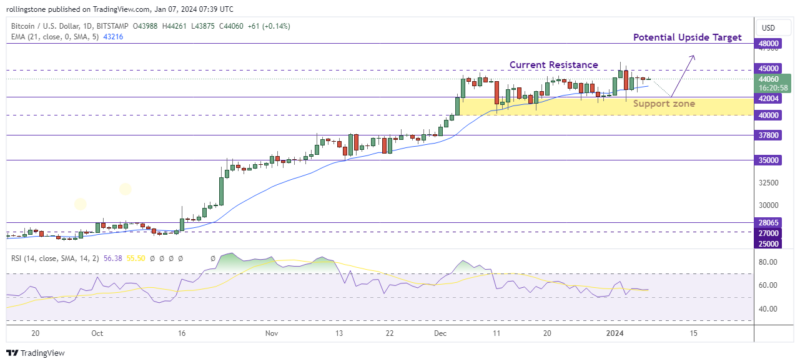
Everyone involved in the cryptocurrency markets is anxiously awaiting the approval of a Bitcoin spot ETF. This is made evident by the fact that on January 3, the price of Bitcoin fell 11%, leading to millions of dollars being liquidated.
Bitcoin is now trading at $43,800, but it might rise as high as $50K. Traders are encouraged to proceed with caution as a result of the increased volatility caused by the large number of investors looking forward to trading the news.
Technically, the BTC/USD price had rejected the support at $42,000 multiple times and regained its position above the 21 EMA, suggesting a further bullish move. We can expect a bullish breakout at the current resistance near $45,000, with the price filling the upside target at $48,000 until the relative strength index (RSI) remains above 50.
See Related: Bitcoin And Ethereum Technical Analysis
Key Findings: ETH Technical Analysis
- Ethereum price got rejected a move above the current support at $2,406 for the third time since December 23, 2023.
- The triple-top pattern formed on the daily chart indicates a possible bearish trend reversal despite the market consolidation.
- We might see the ETH price hitting below $2K if the current support at $2,150 is broken.
Ethereum Technical Analysis – ETH Daily Price Chart
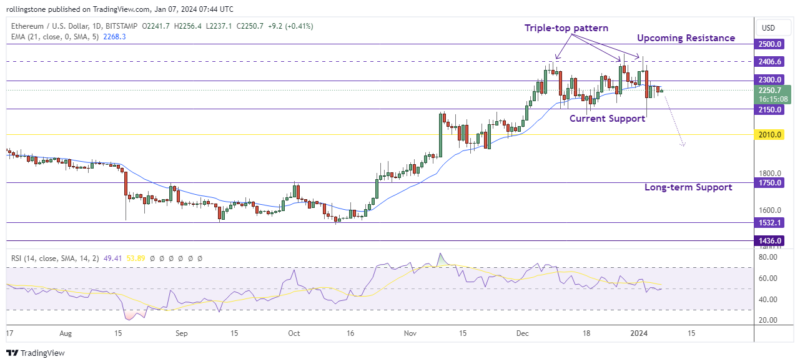
Ethereum failed to exceed the current resistance at $2,406 for the third time, leading the price to break the 21 EMA support and move below the $2,300 level.
According to the current market consolidation, ETH/USD can retest the support at $2,150. A bearish breakout of this level will risk the price for a further loss below the $2K zone. Additionally, the RSI at 49.19 suggests a downside momentum while writing this report.
For a bullish outlook, Ethereum must bounce back from the $2,150 level and exceed $2,300 to survive the overall bullish momentum. In such a case, we’ll closely examine how the price reacts near the $2,406 resistance to assess if ETH can hit the long-term upside target at $2,500.

Affiliate link — we may earn a commission.