
Key Findings: BTC Technical Analysis
- Bitcoin price switched to a short-term bullish trend once the price exceeded the resistance at $28,065 on October 16th.
- We might be witnessing a broad change in the cryptocurrency market sentiment if the $30,000 threshold is broken.
- The price may still retrace near the current support zone ($28K – $27K) before rebounding for an extended bullish move above $30K.
Bitcoin Technical Analysis
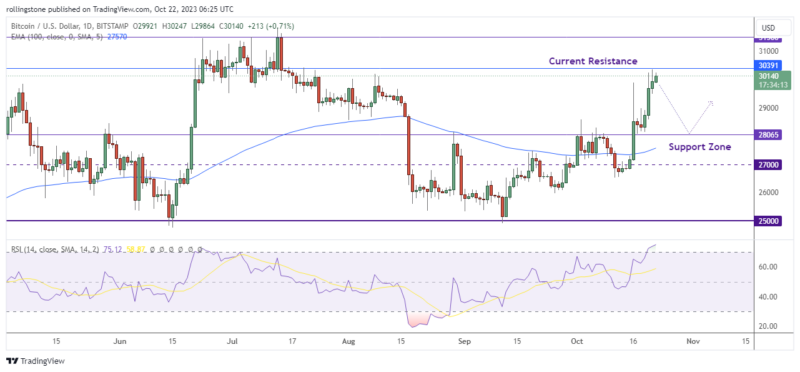
Early in the Asian session, Bitcoin (BTC/USD) showed some bullish momentum as the pair kept circling around the 29746.40 region, which represents the 23.6% retracement of the most recent rising range from $28,122 to $30,248.
BTC/USD tested the 29788 and 29896 regions during gains from the $29,328 area. These positions corresponded to the 50% as well as 61.8% retracements of the most recent declining range from 30248 to 29328.04.
During the current quick advance, stops were set above the $29,964 and $30,127 locations. The upside price goal was linked to purchasing action around the 24900 and 15460 sectors. Targets for related price increases are the $30,688, $31,674, $32,127, and $32,476 levels.
Despite, the overall bullish sentiment, Bitcoin may still retrace near the current support ($28,065) before making another bullish move as the Relative Strength Index (RSI) hit 75.04 already, indicating an overbought market.
Key Findings: ETH Technical Analysis
- Ethereum exceeds the $1,620 resistance following the rejection at support near $1,532.
- The Relative Strength Index (RSI) is at 58, indicating a bullish momentum.
- ETH still needs the break the 100 EMA resistance ($1,676.) to open the door for further gains.
Ethereum Technical Analysis
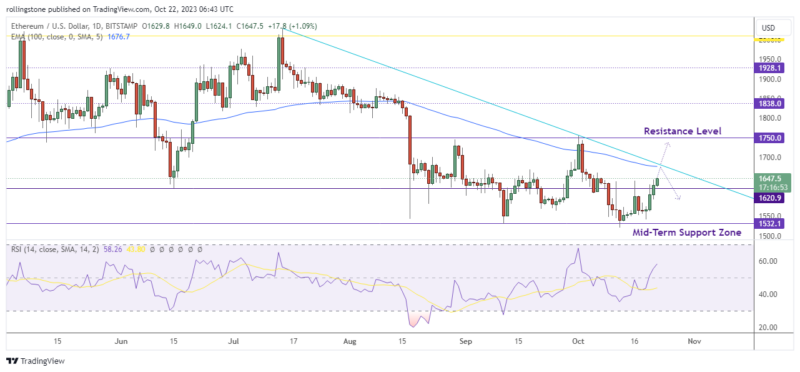
Ethereum price broke out of its several-month consolidation, which favored the bearish. Investors are panicking after this breakthrough, and more decline in ETH is imminent if the situation does not improve.
Bulls have some optimism after the weekend’s price activity, but before investors can relax, ETH needs to clear two significant resistance levels. The first one is the bearish trendline shown in the above daily chart, and the second is the dynamic resistance plotted by the 100 EMA near $1,676.
Given the previously noted positive signal, Ethereum price may give bulls a break if it can turn the $1,639 barrier into a support floor on the daily time frame. This action might draw in more buyers who have been sidelined and possibly start a small surge to retest the next important resistance level of $1,838.

Affiliate link — we may earn a commission.