
Key Findings: BTC Technical Analysis
- Bitcoin ended last week with a solid bullish candle, breaking the 50-EMA resistance.
- The price is currently testing the critical resistance at $60,880.
- BTC might hit $64K this week if the price exceeds the immediate trendline resistance at $61,392.
Bitcoin Technical Analysis – BTC Daily Chart
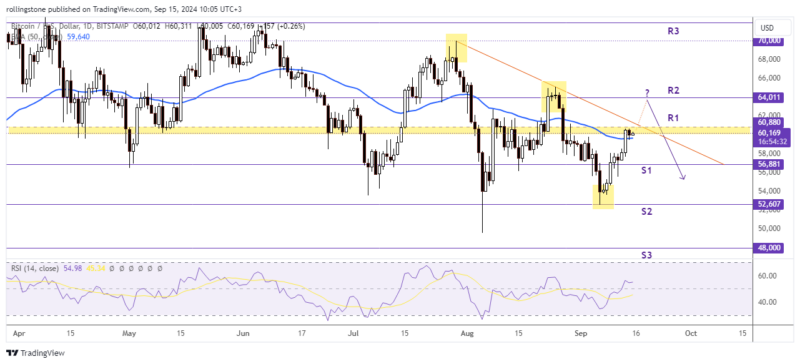
Bitcoin is attempting to soar higher after the price broke the 50-EMA barrier at $59,730. The current bullish stance was initiated following a break of the resistance at $56,881 last week.
The upcoming challenges for BTC bulls are the immediate resistance at $60,880 and the bearish trendline resistance at $61,392. A strong bullish breakout of these levels could push the price to the next resistance at $64,000.
However, the Relative Strength Index (RSI) remains generally unchanged, hovering at neutral, indicating a lack of momentum. The RSI might pass the 50 mark only if the price could hold above $60K and avoid a move below the immediate support of 50-EMA.
For a bearish outlook, BTC might return the $56,881 support if the price fails to break the immediate bearish trendline and returns below the $60K level.
Key Findings: ETH Technical Analysis
- Ethereum passed the $2,400 resistance after the price denied a move below $2,110.
- The RSI at 46.07 (below 50) is yet to confirm a bullish momentum.
- ETH/USD is expected to be cruising towards $2,700 as long as the price holds above the psychological support at $2.4K.
Bitcoin Technical Analysis – ETH Daily Chart
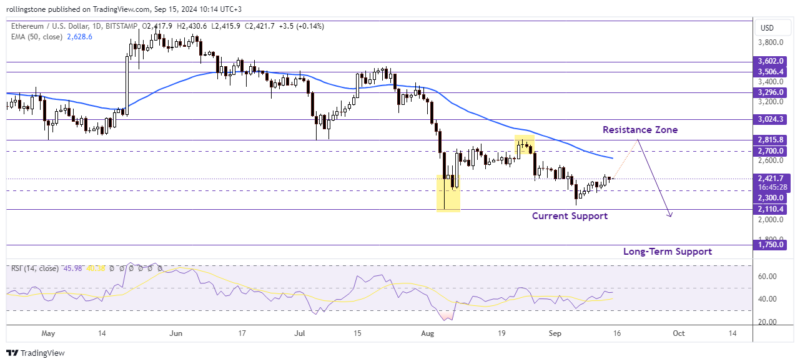
Ethereum was under an overall bullish momentum throughout last week. However, it underperformed Bitcoin and the majority of altcoins, which remains a near-term risk for investors.
According to the daily chart, ETH shows the potential of initiating a bullish trend after the price plotted a higher low above the $2,110 support last week. Additionally, a break above the $2,400 psychological level fueled confidence for buyers. The current bullish stance will remain intact until the price remains above the $2.4K level.
A break of the recent bullish candle’s high at $2,464 could reinforce the bullish momentum and make ETH/USD to pull back above the $2,700 level. Alternatively, failing to sustain above the $2,400 mark might force the price to retest the critical support at $2,110.

Affiliate link — we may earn a commission.