
Blockchain specialist Editah Patrick has mentioned the resistance at $6.83 could be a deciding zone for the upcoming trend of Chainlink in her latest technical report published on Cryptopolitan.
- According to Edith’s analysis, the resistance at $6.83 could be critical for Chainlink as the price inflates to $6.61, as recorded on December 13th. “It (LINK) is currently facing rejection at $6.71, which may indicate that a pullback to the $6.57 support level is likely,” she added.
- The Chainlink daily chart reveals that over the past 24 hours, LINK/USD has retraced to $6.61 as traders took profits off the table in the wake of the strong bullish movement. However, given that it is anticipated to keep gaining momentum in the upcoming weeks, this could be an excellent time for long-term investors to purchase Chainlink on the dip.
- For LINK/USD, the MACD indicators show an upward trend, and the recent price movement indicates a further bullish move. With the 50 EMA currently above the 200 EMA, plotting a bullish crossover. Also, the relative strength index (RSI) is positive at 50, indicating a possible upside rally.
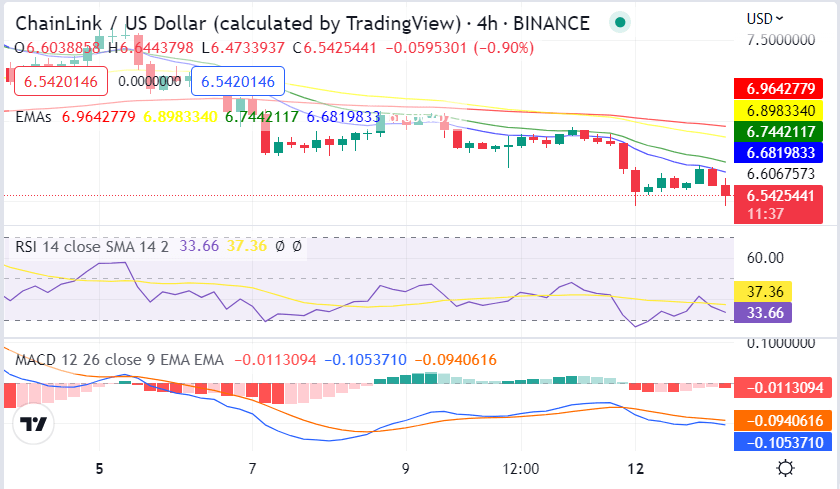
- The 4-hour chart shows the LINK price is consolidating within a tight range from $6.57 to $6.71. Although there seems to be a balance between bullish and negative price movements, we are currently observing positive price movements, which may suggest that the price will continue to rise.
- Furthermore, the MACD line points upward and indicates a solid bullish momentum. This provides technical evidence that the price could increase over the next few days. Additionally, the RSI is at 37.36, indicating a market that may be due for a fall and is slightly overbought. Another technical support for this bullish trend is the EMA crossing, which is positive on the 4-hour chart.
See Related: Chainlink (LINK) Price Prediction For December

Affiliate link — we may earn a commission.