Equity · Communication Services
DIBS
NASDAQ1stdibs.Com (DIBS)
Reddit mentioned DIBS 19 times in the 30 days to 22 October 2026, across 3 of the communities we track. All of them were scored for sentiment: 42% read bullish, 5% bearish and 53% neither. Reddit data updated 22 October 2026.
The line runs $4.11 on 24 July through $4.32 on 21 October, on a scale from $3.5 to $5.5. Days the market did not trade hold the previous close, flat.
as of Oct 21, 2026
1stdibs.Com (DIBS) · crowd attention × price
Share ↗
Day21 Oct 2026
Reddit stayed net bullish on DIBS every day of this window we could measure, and its close rose from $4 to $4.32
DIBS's busiest day for Reddit mentions sat one session from its highest close of the window — 3 mentions on 9 August, $5.08 on 7 August
This chart in words
The chart plots daily Reddit mentions of DIBS over the 30 days to 22 October 2026: 19 in total, busiest on 2 October with 3, and 1 on the last day counted. The line is the daily close over the same window: $4 on 23 September, $4.32 on 21 October. Of those days, 21 were trading sessions and the other 9 are hatched on the chart. On 8 of them no session took place, and the last close before it is carried forward rather than plotted; on 1 of them we hold no close at all, which is a gap in our own record rather than a closure we can prove. Sentiment — the bullish share of the mentions that took a side, where the chart's dashed rule marks the 50% at which bullish and bearish are even — ran from 75% bullish to 100% bullish over the 5 days that carried enough mentions to measure. 21 days either fell under the 5-mention floor or carried no bullish or bearish mention at all, and so carry no sentiment point.
The chart plots daily Reddit mentions of DIBS over the 90 days to 22 October 2026: 51 in total, busiest on 9 August with 3, and 1 on the last day counted. Across this window the close ran between $3.66 on 12 October and $5.08 on 7 August. The line is the daily close over the same window: $4.31 on 27 July, $4.32 on 21 October. Of those days, 62 were trading sessions and the other 28 are hatched on the chart. On 25 of them no session took place, and the last close before it is carried forward rather than plotted; on 2 of them no session took place, and this window holds no earlier close to carry forward; on 1 of them we hold no close at all, which is a gap in our own record rather than a closure we can prove. Sentiment — the bullish share of the mentions that took a side, where the chart's dashed rule marks the 50% at which bullish and bearish are even — ran from 67% bullish to 100% bullish over the 12 days that carried enough mentions to measure. 76 days either fell under the 5-mention floor or carried no bullish or bearish mention at all, and so carry no sentiment point.
1stdibs.Com (DIBS) on Reddit · 30d
In the 30 days to 23 Oct 2026, 1stdibs.Com drew 19 Reddit mentions in the finance subreddits we track, 19 of them scored for sentiment.
 bullish
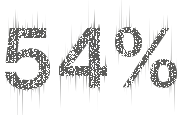 bullish
DIBS reads 12 points less bullish than overall market sentiment. Same measure; same 30-day window.
Where DIBS is discussed
(30d)Moves with DIBS
co-mention r · 31 obsTickers whose daily Reddit volume rose and fell with DIBS's. Co-discussion, not price.
How closely daily Reddit mention counts rose and fell together over the last 30 days (31 daily observations) · Method
1stdibs.Com (DIBS) insider trades
In the 90 days to 23 Oct 2026, no 1stdibs.Com insider bought or sold shares on the open market; all 6 Form 4 filings in that window were grants, exercises, tax withholding or transfers (SEC Form 4).
Compensation mechanics Share grants, option exercises, tax withholding and transfers. They reach the same Form 4 as a trade, but they are not the insider buying or selling on the open market, so no purchase or sale value applies to them.
1stdibs.Com (DIBS) reported financials
SEC EDGAR1stdibs.Com reported revenue of $89.6M for the fiscal year ended 31 Dec 2025. Net income over the same period was −$13.7M.
1stdibs.Com (DIBS) earnings
1stdibs.Com last reported earnings on 30 Jun 2026 for Q2 2026, with EPS of −$0.03; no next date is announced in SEC filings yet.
no date announced in SEC filings yet
Reported figures & scheduled dates · SEC EDGAR filings
1stdibs.Com (DIBS) institutional holders (13F)
SEC EDGAR5 of the 45 institutional funds we track reported a 1stdibs.Com position for the quarter ended 30 Jun 2026 — a combined $4.9M; the latest of those filings landed 02 Sep 2026.
1stdibs.Com (DIBS) fails-to-deliver
SECOn 16 Sep 2026, 882 shares of 1stdibs.Com failed to deliver (about $4K).
1stdibs.Com (DIBS): frequently asked questions
Have 1stdibs.Com insiders bought or sold shares recently?
In the 90 days to 23 Oct 2026, no 1stdibs.Com insider bought or sold shares on the open market; all 6 Form 4 filings in that window were grants, exercises, tax withholding or transfers (SEC Form 4).
How many institutions hold 1stdibs.Com?
5 of the 45 institutional funds we track reported a 1stdibs.Com position for the quarter ended 30 Jun 2026, per SEC Form 13F filings.
Has 1stdibs.Com had fails-to-deliver recently?
Yes. The most recent SEC fails-to-deliver record for 1stdibs.Com is dated 16 Sep 2026, when 882 shares failed to deliver.
When did 1stdibs.Com last report earnings?
1stdibs.Com last reported earnings on 30 Jun 2026 for Q2 2026, with EPS of −$0.03; no next date is announced in SEC filings yet.
What exchange is 1stdibs.Com listed on?
1stdibs.Com trades on NASDAQ under the ticker DIBS.
What is Reddit saying about 1stdibs.Com?
1stdibs.Com was mentioned 9 times in the last 7 days across the finance subreddits we track, and 19 times over the trailing 30 days. Of 19 classified mentions, 42% read bullish, 5% bearish and 53% neutral. Crowd sentiment is a social signal, not investment advice.
Answers are generated from the live figures on this page — Reddit crowd data, SEC filings and open company records — and update as the data does.
Sources
- Finazonprior-day close, indicative (IEX-derived, not the official close), some closes dollar-rounded at the source
- TradingViewthe price chart widget, drawn by TradingView from their own data
- RedditReddit ingest across the tracked finance subreddits
- SEC EDGARSEC EDGAR XBRL company facts · latest period ended 30 Jun 2026
- SEC EDGARSEC EDGAR 13F filings
- SECSEC fails-to-deliver (CNS) data
- SEC EDGARValuation computed from SEC EDGAR filings