
Key Findings: BTC Technical Analysis
- Bitcoin holds around $97,000 on Friday, after losing pre-Christmas gains on Thursday.
- On-chain data indicate an increase in taker buy volume and stablecoin deposits on Binance.
- BTC price rebound is expected when US spot Bitcoin ETFs halt their outflow trend and the volume of staked Bitcoin increases.
Bitcoin Technical Analysis
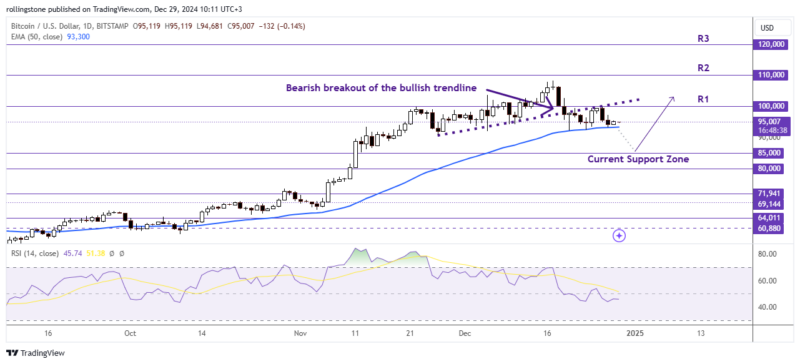
Bitcoin is changing hands around $97,000, giving back most of the gains made from its early-week rally. The largest cryptocurrency missed an anticipated “Santa Claus rally”—a seasonal price boost around Christmas.
The RSI of Bitcoin still remains neutral at around 50, indicating indecision among traders. The MACD indicator shows negative momentum below the neutral line, with red histogram bars below it.
Key support levels to watch include $92,500, a threshold tested since mid-December, and the November 12 low of $85,000. A daily close above the $100,000 resistance might invalidate the bearish outlook and open the path toward a retest of Bitcoin’s all-time high of $108,353.
Although Bitcoin faces short-term headwinds, the revival of institutional interest and strong on-chain activity hint at a promising long-term trajectory. A decisive move above critical resistance levels could spark renewed bullish momentum.
See Related: Bitcoin And Ethereum Technical Analysis: Bitcoin Consolidates Near $60,000 As The Selloff Cools
Key Findings: ETH Technical Analysis
- Ethereum consolidates at $3,352.70, forming a symmetrical triangle pattern signaling volatility.
- The key resistance is $3,506, while the support zone lies around $3,296 to $3,024.
- The RSI at 52 shows neutral momentum as traders watch for a decisive breakout.
Ethereum Technical Analysis
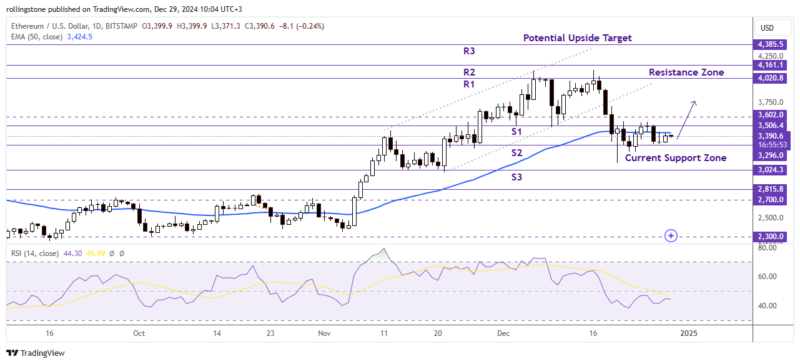
Ethereum consolidated at $3,352.70, down 1.76% in the last 24 hours, and has a trading volume of $18.71 billion. The symmetrical triangle pattern of the asset in the price chart is representative of a point that always precedes high volatility.
Key resistance lies at $3,350, closely aligned with the 50-day EMA at $3,355, thus making it an important level for the bulls to break. A successful upside break higher than this may eye $3,520 for an initial rally, possibly to $3,700.
On the downside, immediate support comes in at $3,221, while the next key level is at $3,097. Breaches in these supports are likely to further sink the bearish trend.
The RSI is reading 52, indicating neutrality in momentum and leeway for upward and downward movements. Traders are closely watching this narrowing range, as the resolution of the triangle is expected to define Ethereum’s next trend. The elevated trading activity underlines the anticipation of a decisive move in the market.