
Key Findings: BTC Technical Analysis
- Bitcoin hits its lowest point since May 3 while rebounding from its losses.
- BTC/USD has been consolidating around the $60K for five days in a row.
- The price might hit the immediate support at $56,881 this week following the mounting sell pressure.
Bitcoin Technical Analysis – BTC/USD Daily Chart
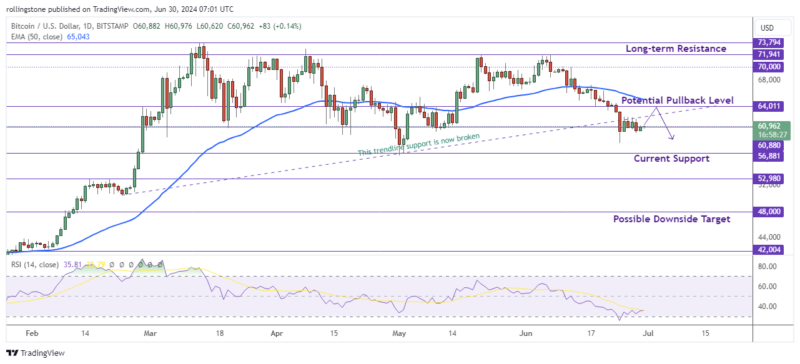
With Bitcoin losing a large portion of its 2024 rise and momentarily dipping below the psychological $60,000 barrier to reach deeper than a one-month low, it is evident that the cryptocurrency market is not in the best position.
As the likelihood of higher interest rates would negatively impact risk-sensitive assets, the bad news began when the Fed’s updated dot plot suggested one rate drop for the year.
Since early June, there has been a significant selloff in BTCUSD (Bitcoin), with the price briefly falling below the psychological $60,000 barrier. The price has been rangebound in the last several sessions, failing to mount a rebound, although managing to stop its decline just short of the 200-MA.
If Bitcoin were to revert to below the psychological $60,000 mark, the $59,600 support level from March–April would provide instant support. If the price drops below that level, it might even challenge the $58,400 June low.
Conversely, should purchasing pressures return, the price may rise to $64,500, a zone that has served as both support and resistance in 2024. If the bulls take control of that area, they might go after the $67,270 April resistance level.
See Related: Bitcoin and Ethereum Technical Analysis: BTC Price Is Challenging The Resistance At $43,000
Key Findings: ETH Technical Analysis
- Ethereum broke the triangle support on the daily price chart.
- The price also rejected a move above the 50-EMA, indicating a further bearish rally.
- ETH/USD might counter surprise buy pressure between the $3,024 – $3,200 support zone despite the overall bearish sentiment.
Ethereum Technical Analysis – ETH/USD Daily Chart
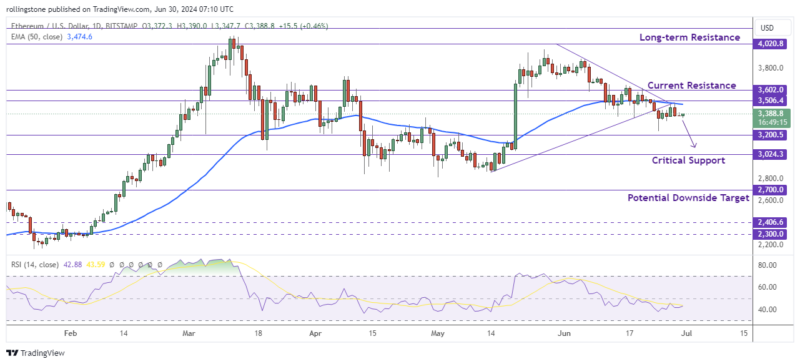
On June 29, 2024, Ethereum price decreased by -0.193%, from $3,383 to $3,377. The cryptocurrency changed 1.22% from a day low of $3,371 to a daily high of $3,412 during the most recent trading day. The price is down -4.71% during the past 10 days and has dropped in 7 of those days. Volume should have decreased in tandem with the coin, therefore it’s encouraging that it did so on the final day.
At $3,314, Ethereum meets support from accumulated volume, and as an upward reaction is anticipated when the support is being challenged, this level can present a buying opportunity.
This cryptocurrency is thought to have a medium level of risk due to its average daily swings and strong trading volume. The cryptocurrency fluctuated $41.25 between its high and low points over the previous day or 1.22%. The cryptocurrency’s average daily volatility over the past week has been 2.98%.
Ethereum will be technically under an overall bearish momentum until the price exceeds the 50-EMA resistance near $3,474 and the horizontal resistance at $3,506. Alternatively, a bearish breakout of the current consolidation range might lead ETH/USD price between the $3,024 – $3,200 support zone.

Affiliate link — we may earn a commission.