
Key Findings: BTC Technical Analysis
- The bitcoin price is roaming around $62.5K following a sidelined market condition.
- The price plotted false-break patterns at the nearest support and resistance levels, which confuses market participants.
- To initiate a fresh market trend, a solid breakout is needed either above $65K or below $60K.
Bitcoin Technical Analysis – BTC Daily Chart
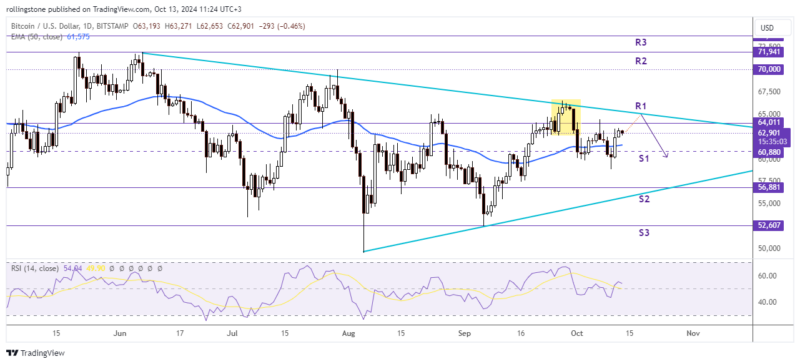
Bitcoin prices have consistently been forming lower highs on the daily chart since failing to break the bearish trendline near $66,260 on September 27. Recently, the price was rejected from the immediate horizontal resistance at $64,011, confirming strong supplies lying within the $64K-$66K resistance zone.
However, the bearish movements were countered by fresh demands near the dynamic support of 50-EMA. The price rebounded from this level twice and formed a double-bottom pattern, which generally indicates a bullish movement.
According to the daily chart, the Bitcoin price collapsed inside the trendline support and resistance, causing a flat-trend market. However, the RSI is still above 50 (53.26), indicating bullish momentum. The price must break the immediate trendline resistance and the horizontal level at $64 to turn this momentum into a sustainable bullish trend and head toward the $70k level.
Alternatively, failing to break above the immediate resistance levels will push the price below $60, and a weekly close below this level will lead the price to a deeper correction near $55K.
See Related: Bitcoin And Ethereum Technical Analysis: BTC Price Tests Major Support At $52K Following A Solid Downtrend
Key Findings: ETH Technical Analysis
- Ethereum failed to break the dynamic resistance at 50-EMA ($2,528) since the price got rejected from the $2.7K level.
- The price also failed to test the trendline resistance at the daily chart, suggesting an ongoing bearish trend.
- ETH may retest the support at $2,110 if the price fails to secure its position above $2.5K this week.
Ethereum Technical Analysis – ETH Daily Chart
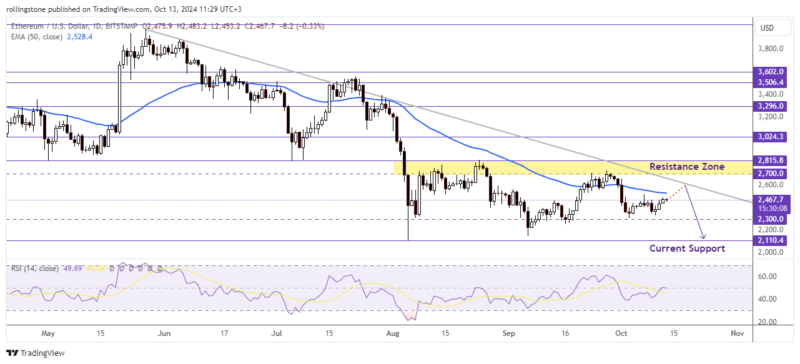
Ethereum denied a move above the $2.8K resistance level several times since the price broke the critical support at $2,815 on August 4. Recently, the price failed to exceed the $2.7K level, suggesting more supplies inside the $2.7K-$2.8K zone. Additionally, there is a bearish trendline on the daily chart, which offers a fresh resistance near $2.6K.
From a technical point, the price shows no sign of bullish movements anytime soon but indicates an upcoming bearish rally based on multiple factors. For instance, failing to break above $2.8K, sliding below the 50-EMA, and maintaining a position below the daily trendline resistance are all suggesting a potential downtrend ahead.
ETH/USD must break the 50-EMA and the $2.7K level to avoid a deeper correction from the current stage. Otherwise, holland below these resistance levels for another week will only accelerate the growing supplies and crash the price below the critical support at $2,110.

Affiliate link — we may earn a commission.